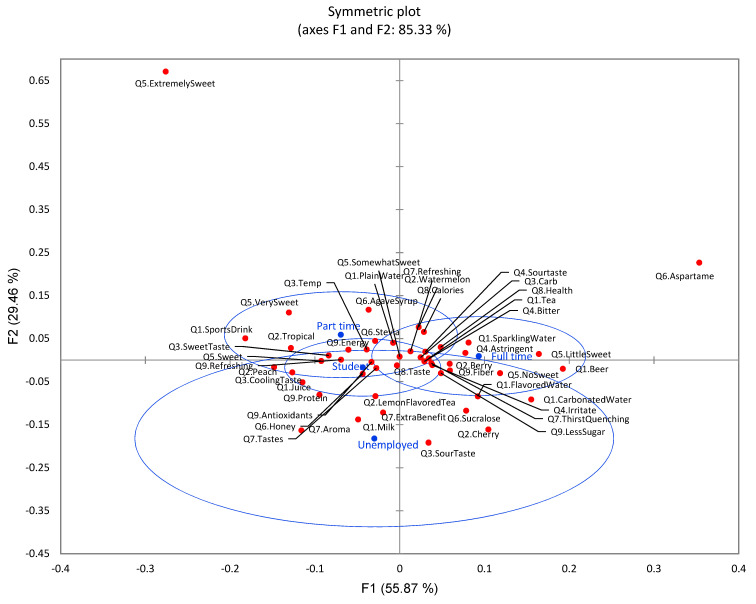
Figure 14.
The first two dimensions of correspondence analysis (CA) symmetric plot using employment status (college student, full time, part time, and unemployed) as Rows and all nine survey questions as Columns (n = 901) (4 rows × 54 columns). Confidence ellipses on the plot were automatically created by XLSTAT software based on CA with observed χ2 = 163.41 and p = 0.389.

