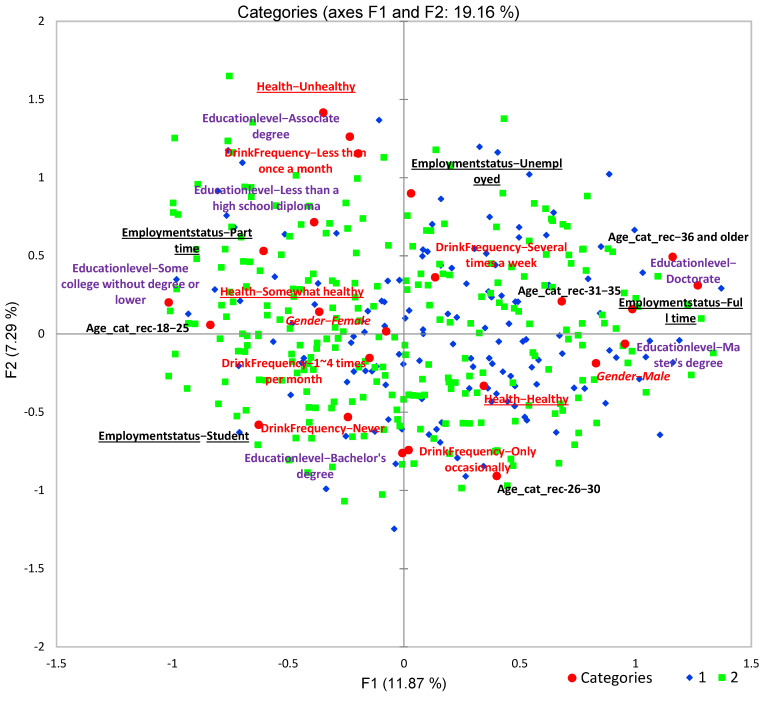
Figure 15.
Multiple correspondence analysis (MCA) of two clusters of consumers (blue diamonds represent cluster 1 with n = 410 and green squares represent cluster 2 with n = 491) characterized by six demographics (gender, age, health condition, drink frequency, education level, and employment status) in different colors and fonts.

