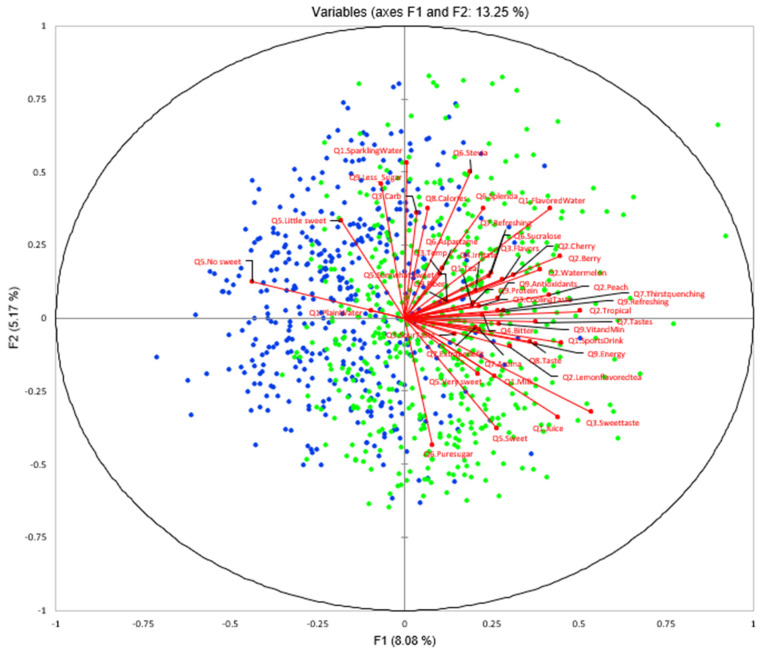
Figure 16.
Internal preference mapping (IPM) of two clusters of consumers (blue diamonds represent cluster 1 with n = 410 and green squares represent cluster 2 with n = 491) characterized by nine survey questions (Q1–Q9, 41 selection total), which were selected by significance of chi-square analysis between two clusters.

