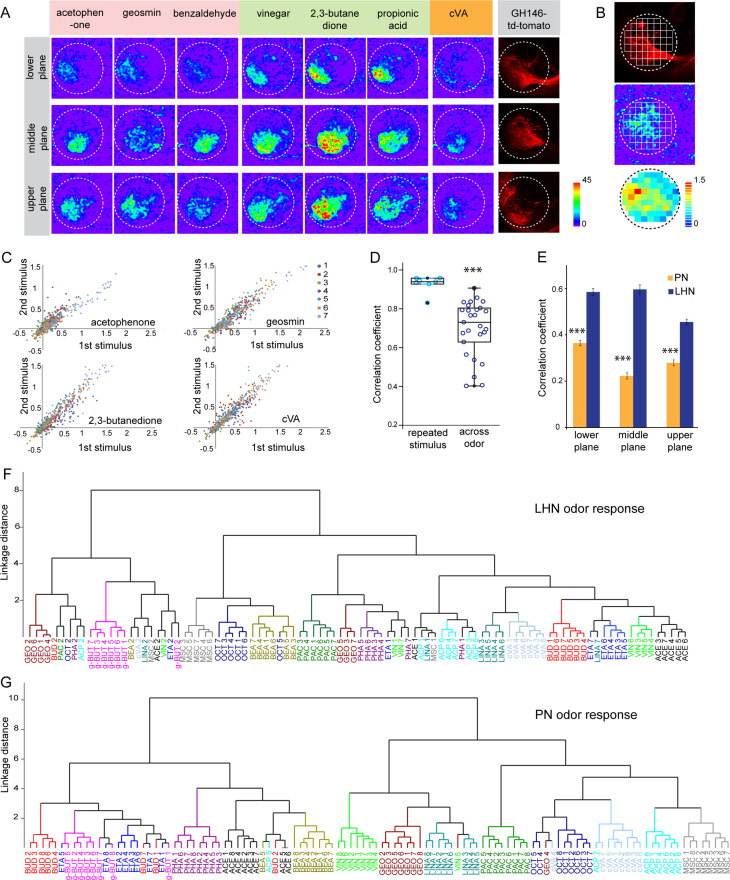
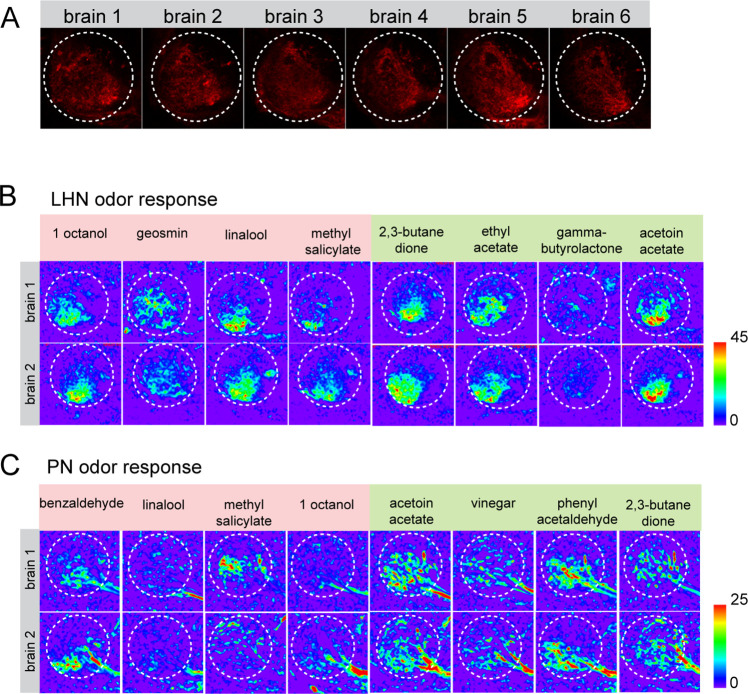
Figure 2. Odor response properties of glutamatergic lateral horn neurons (LHNs) and uniglomerular projection neurons (uPNs).
(A) Representative images of calcium responses of glutamatergic LHNs in the LH brain area in three focal planes, evoked by various odors (repulsive odors: acetophenone, geosmin, benzaldehyde; attractive odors: vinegar, 2,3 butanedione, propionic acid; pheromone: cVA). Right panel shows the innervation pattern of uPNs labeled by GH146 in three different focal planes, used as a landmark to maintain comparable focal planes for functional imaging across different animals. (B) Grid approach to analyze odor-evoked responses of glutamatergic LHNs. Representative images of the grid onto uPN labeling (upper panel), used as a background landmark, odor-evoked responses of glutamatergic LHNs (middle panel) and analyzed ΔF/F of each pixels from glutamatergic LHNs in the LH area (lower panel). (C) Scatter plot showing calcium responses of each pixel of glutamatergic LHNs at middle plane to repeated presentation of an odor stimulus. Different colored dots depict responses obtained from different animals (n = 7). (D) Box plot represents comparison of odor-evoked responses of glutamatergic LHNs at middle plane, between repeated and across odor stimuli (Student’s t-test, ***p<0.001). (E) Comparison of correlation coefficients of uPN and LHN responses at three different focal planes. Different odors seem to be better segregated at the uPN level than at the level of LHNs (Student’s t-test, ***p<0.001). (F) Cluster analysis of LHN odor responses based on linkage distance (n = 7, ANOSIM, sequential Bonferroni significance, p=0.0001). (G) Cluster analysis of uPN odor responses based on linkage distance (n = 8; ANOSIM, sequential Bonferroni significance, p=0.0001). Both cluster analyses reveal that the majority of replicates for each odor are grouped together.


