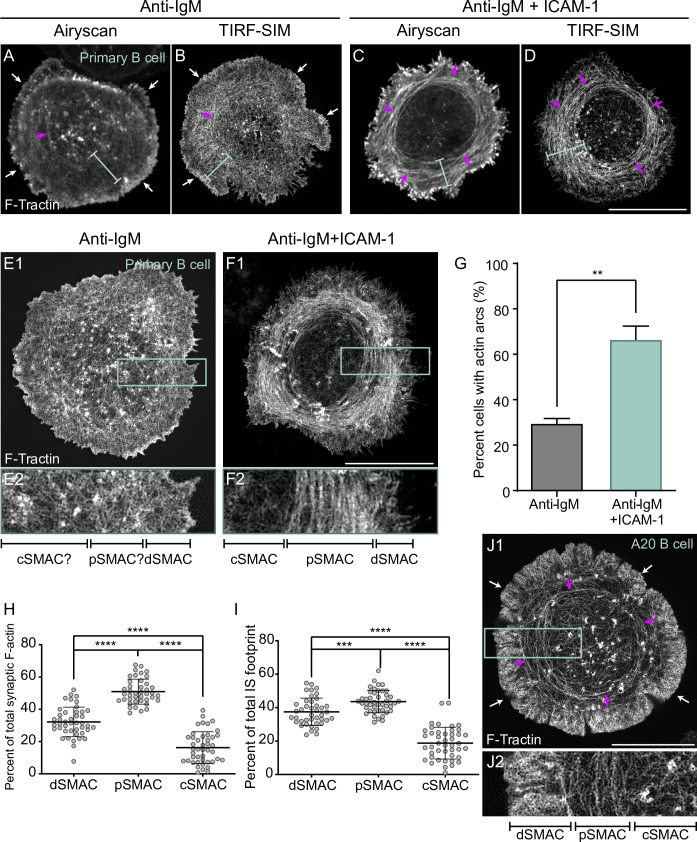
Figure 1. ICAM-1 co-stimulation promotes the formation of actin arcs at the B-cell immune synapse.
(A–F) GFP-F-Tractin-expressing primary B cells on glass coated with anti-IgM alone (A, B, E1, E2) or with anti-IgM + ICAM-1 (C, D, F1, F2) and imaged using Airyscan (A, C) or TIRF-SIM (B, D, E1, E2, F1, F2). The white arrows in (A) and (B) indicate the thin outer rim of dendritic actin in the dSMAC. The blue bars in (A–D) indicate the pSMAC. (E2) and (F2) correspond to the boxed regions in (E1) and (F1), respectively. Of note, the cell shown in (E1/E2) is representative of ~70% of anti-IgM-stimulated cells, while the cell shown in (F1/F2) is representative of ~70% of anti-IgM + ICAM-1-stimulated cells. (G) Percent of cells with pSMAC actin arcs (N > 67 cells/condition from three experiments). (H, I) Percent of total synaptic F-actin (H) and percent of total IS footprint (I) contained within the dSMAC, pSMAC, and cSMAC portions of the synapse for primary B cells on anti-IgG/ICAM-1-coated glass (N = 44 cells/condition from six experiments). (J1, J2) GFP-F-Tractin-expressing A20 B cell on anti-IgG/ICAM-1-coated glass. (J2) corresponds to the boxed region in (J1). The magenta arrows in (A–D) and (J1) indicate actin arcs. Scale bars: 10 µm.


