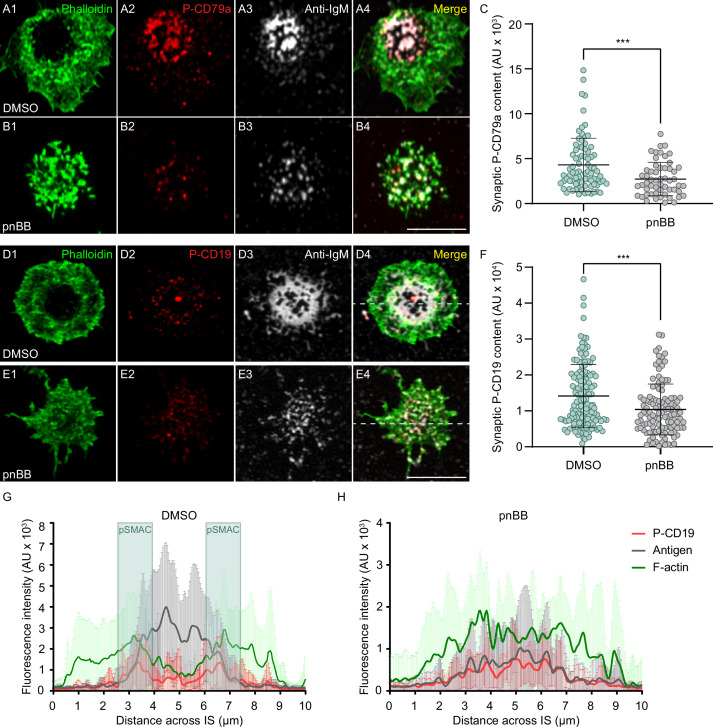
Figure 6. Myosin 2A contractility promotes B-cell receptor (BCR) signaling.
(A1–A4) DMSO-treated primary B cell 10 min after engagement with a PLB containing ICAM-1 and limiting anti-IgM, and stained for F-actin and P-CD79a. (B1–B4) Same as (A1–A4) except the B cell was treated with pnBB. (C) Synaptic P-CD79a content (N = 55–81 cells/condition from three experiments). (D1–D4) DMSO-treated primary B cell 10 min after engagement with a PLB containing ICAM-1 and limiting anti-IgM, and stained for F-actin and P-CD19. (E1–E4) Same as (D1–D4) except the cell was treated with pnBB. (F) Synaptic P-CD19 content (N = 115–140 cells/condition from three experiments). (G) Fluorescence intensities across synapses for P-CD19 (red), antigen (gray), and F-actin (green) in B cells treated with DMSO (N = 22 cells from two experiments). The position of the pSMAC is highlighted in blue. (H) Same as (G) except the cells were treated with pnBB (N = 16 cells from two experiments). All panels: Airyscan images. Scale bars: 5 µm in (B4); 3 µm in (E4).


