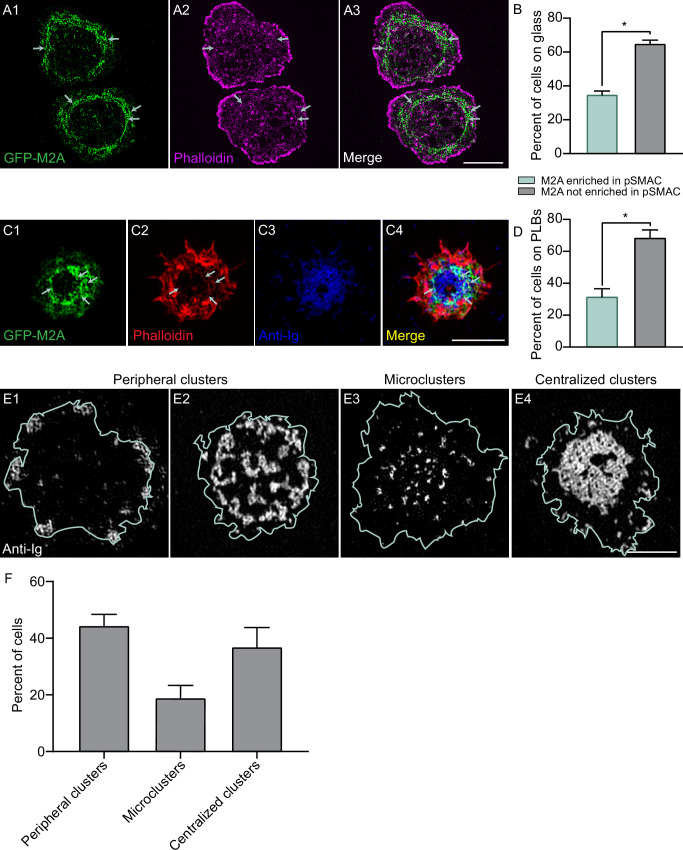
Figure 7. Germinal center B cells make actomyosin arcs.
(A1–A3) Phalloidin-stained primary GC B cell from the M2A-GFP knockin mouse on anti-IgM/anti-IgG/ICAM-1-coated glass. White arrows mark the actomyosin arcs. (B) Percent of cells on glass that did or did not show M2A enrichment in the pSMAC (N = 140 cells from four experiments). (C) Phalloidin-stained primary GC B cell from the M2A-GFP knockin mouse 15 min after engagement with a PLB containing anti-IgM, anti-IgG, and ICAM-1. (D) Percent of cells on PLBs that did or did not show M2A enrichment in the pSMAC (N = 89 cells from four experiments). (E1–E4) Representative images of the three types of anti-Ig distribution exhibited by GC B cells 15 min after engagement with a PLB containing anti-IgG and ICAM-1 (cell outlines are shown in blue). (F) Percent of GC cells displaying the three types of anti-Ig distribution shown in (E1–E4) (N = 157 cells from six experiments). All panels: TIRF-SIM images. Scale bars: 5 µm in (A3); 3 µm in (C4, E4).


