. 2022 May 11;11:e73346. doi: 10.7554/eLife.73346

Figure 3. Demographic model for extinct and extant equine lineages as inferred by G-PhoCS (Gronau et al., 2011).

Node bars represent 95% confidence intervals. The width of each branch is scaled with respect to effective population sizes (Ne). Independent Ne values were estimated for each individual branch of the tree, assuming constant effective sizes through time. Migration bands and probabilities of migration (transformed from total migration rates) are indicated with solid arrows. The red triangle indicates the earliest Sussemionus evidence found in the fossil record. (Images: E. caballus by Infomastern, E. a. somalicus by cuatrok77, E. kiang by Dunnock_D, E. a. africanus by Jay Galvin, E. hemionus by Cloudtail the Snow Leopard, E. z. hartmannae by calestyo, E. b. quagga by Internet Archive Book Images, E. b. boehmi by GRIDArendal, and E. grevyi by 5of7.)

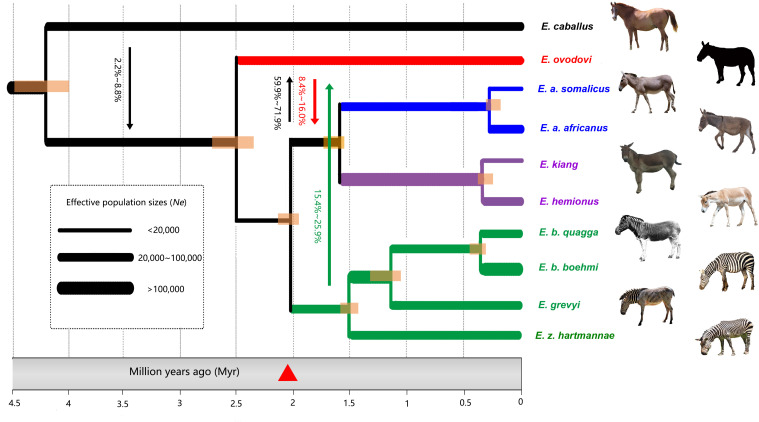
Figure 3.

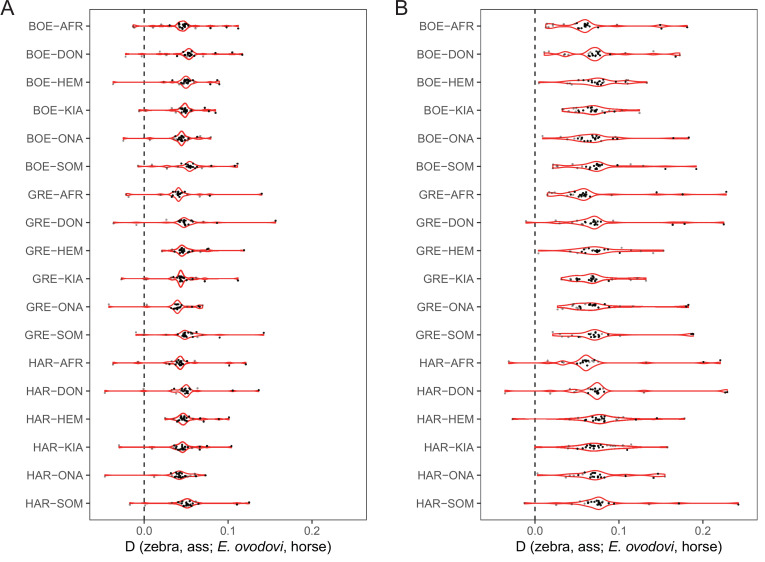
Figure 3—figure supplement 1. D-statistics in the form of (zebra, ass; E. ovodovi, outgroup), using sequence alignments against the horse reference genome.

Figure 3—figure supplement 1.

Significantly positive D-statistics are indicative of an excess of shared derived polymorphisms between E. (Sussemionus) ovodovi and extant assess, which is compatible with admixture between both lineages. The nonsignificant results are shown in gray. (A) Including transitions. (B) Excluding transitions.
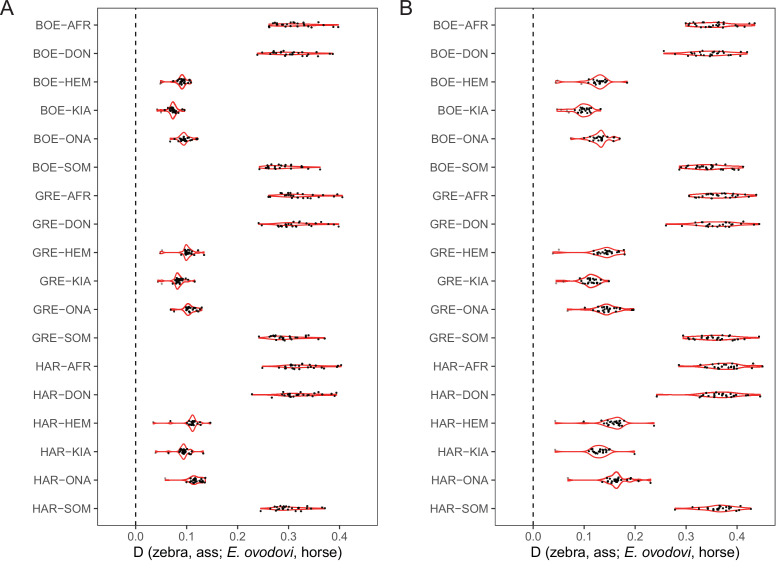
Figure 3—figure supplement 2. D-statistics in the form of (zebra, ass; E. ovodovi, outgroup), using sequence alignments against the donkey reference genome.

Figure 3—figure supplement 2.

Significantly positive D-statistics are indicative of patterns of shared derived polymorphisms between E. (Sussemionus) ovodovi and extant assess, which is compatible with admixture between both lineages. The nonsignificant results are shown in gray. (A) Including transitions. (B) Excluding transitions.
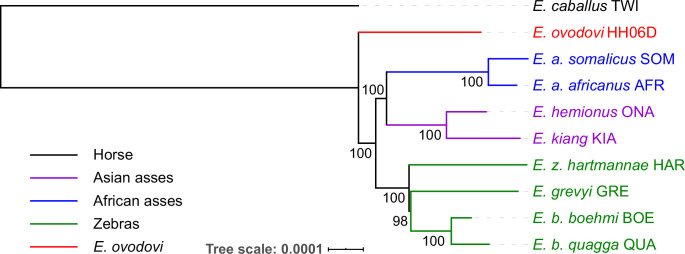
Figure 3—figure supplement 3. Neighbor-joining (NJ) tree of selected samples based on 15,324 candidate ‘neutral’ loci identified using sequence alignments against the horse reference genome (detailed in ‘Data preparation and filtering).

Figure 3—figure supplement 3.

Node supports were assessed from 1000 bootstrap pseudo-replicates.