. 2022 May 11;11:e73346. doi: 10.7554/eLife.73346

Figure 4. Pairwise sequential Markovian coalescent (PSMC) profiles (100 bootstrap pseudo-replicates) of four Eurasian equine species (E. ovodovi HH06D, E. caballus TWI [Kalbfleisch et al., 2018], E. hemionus ONA, and E. kiang KIA) (Jónsson et al., 2014).

The y-axis represents the effective population size (×10,000), and the x-axis is scaled in millions of years before present. Faded lines show bootstrap values.

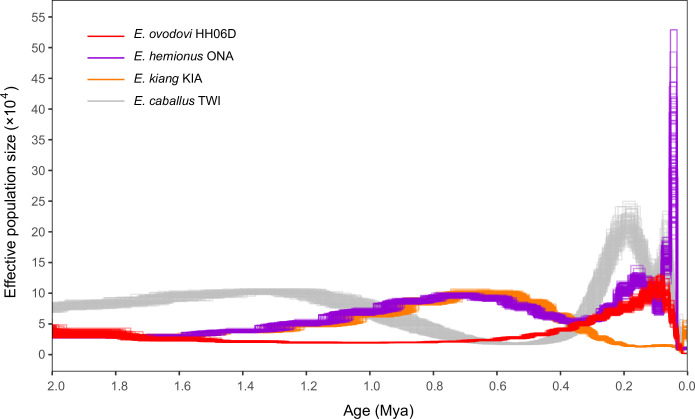
Figure 4.

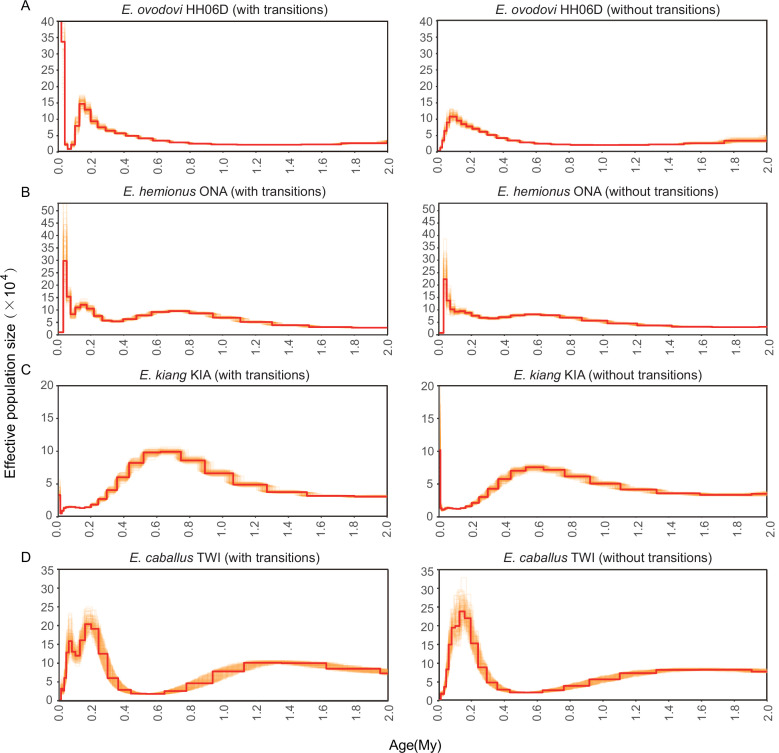
Figure 4—figure supplement 1. Pairwise sequential Markovian coalescent (PSMC) bootstrap pseudo-replicates for samples with (left) and without (right) transitions.

Figure 4—figure supplement 1.

(A) HH06D, (B) ONA, (C) KIA, and (D) TWI. The E. ovodovi genome still included, even after rescaling, a significant proportion of nucleotide misincorporations pertaining to postmortem DNA damage. This resulted in the presence of an excessive fraction of singleton mutations along this lineage, and the artifactual expansion observed in the most recent time range.
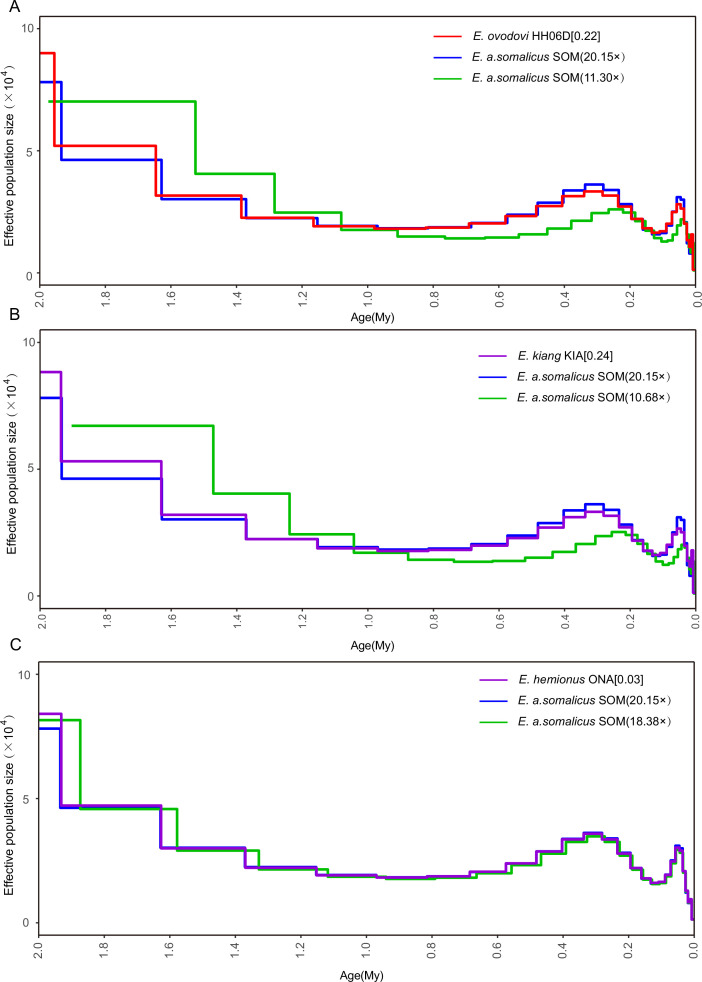
Figure 4—figure supplement 2. Determining the uniform false-negative rate (uFNR) that was necessary for scaling pairwise sequential Markovian coalescent (PSMC) results.

Figure 4—figure supplement 2.

(A) HH06D (11.30×), (B) KIA (10.68×), and (C) ONA (18.38×). The most suitable uFNR values for rescaling the PSMC profile are reported between squared brackets, to the right of the species names considered. The PSMC trajectory retrieved when considering all the sequence data available for the SOM individual is shown in blue. The green line provides the PSMC trajectory reconstructed when downsampling these data to the average genome depth of coverage obtained for the species examined (top: Equus Sussemionus, red; center: Equus kiang, purple; and bottom: E. hemionus, purple).