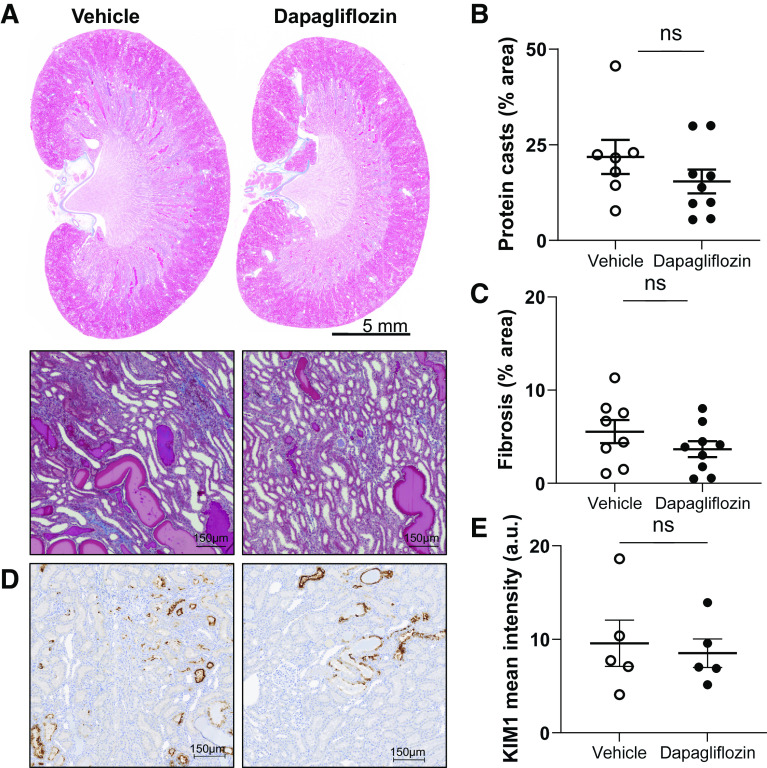
Figure 4.
Kidney injury in Dahl salt-sensitive rats. A: representative images of kidney tissue stained with Masson’s trichrome and expanded areas at ×10 magnification. Scale bars = 5 mm and 150 µm, respectively. B and C: summary graphs of the medullary protein cast area (percent total kidney area; B) and whole kidney fibrosis (C). D: representative immunohistochemical staining of kidney cortical sections for detection of kidney injury molecule-1 (KIM-1) at a magnification of ×10. Scale bars are shown. E: summary graph of tubular kidney injury by KIM-1 intensity. n ≥ 5. ns, not significant.

