
Figure 2.
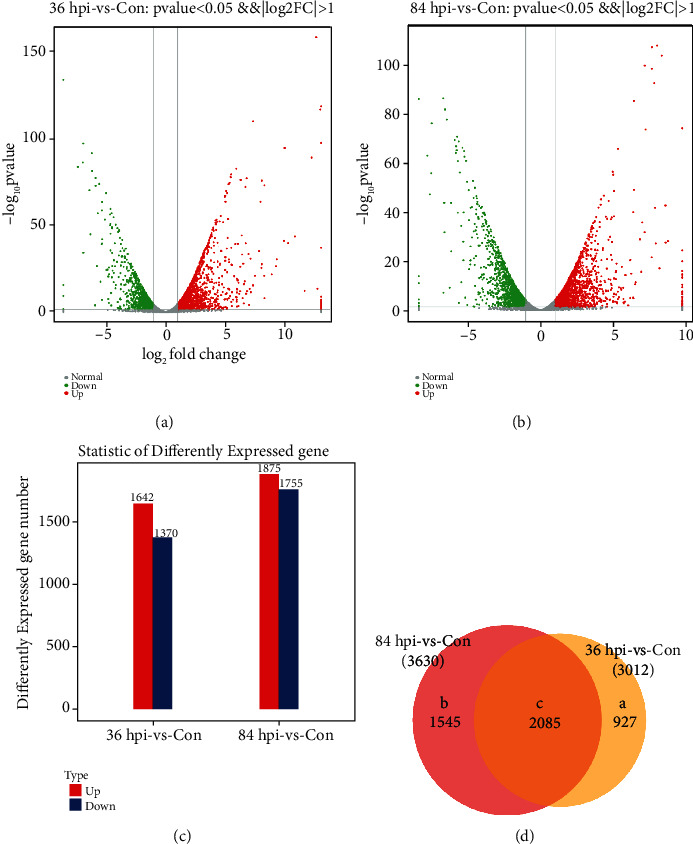
Differentially expressed genes (DEGs) of S. lycopersici. (a) Volcano plot of the global comparison of transcript profiles between Con and 36 hpi. Gray dots indicate genes of no significance. Red dots indicate upregulated genes meeting the thresholds of log2 fold change > 1 and padj < 0.05. Green dots indicate downregulated genes meeting the thresholds of log2 fold change < −1 and padj < 0.05. (b) Volcano plot of the global comparison of transcript profiles between Con and 84 hpi. (c) Statistical histogram of the DEGs. Red and blue columns represent the up- and downregulated genes, respectively. (d) Venn plot of common and unique DEGs between the different comparison groups. Region a represents the number of DEGs only in 36 hpi-vs-Con. Region b represents the number of DEGs only in 84 hpi-vs-Con. Region c represents the number of DEGs present in both comparison groups.