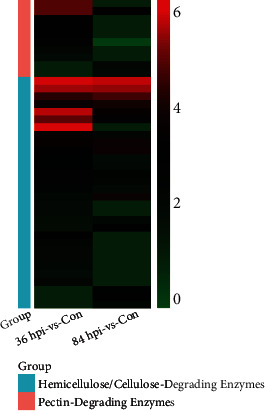
Figure 7.

A heatmap of differentially expressed genes associated with CWDEs. Each small square represents a CWDE-associated DEG, and the color represents the log2 fold change of gene differential expression. Red indicates genes with high expression levels in 36/84 hpi-vs-Con. Green indicates genes with low expression levels in 36/84 hpi-vs-Con.
