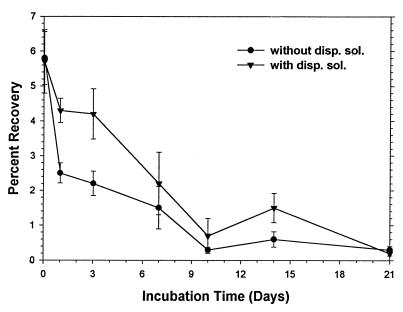
FIG. 3.
Plot of percentages of oocyst (from diluted calf diarrhea) recovery from sandy loam soil versus storage time with and without dispersing solution (disp. sol.) (Tris-Tween 80). The error bars indicate standard deviations (n = 6). The initial oocyst concentration was 104 oocysts per 25 g of soil. The first sample was obtained 1 h after spiking.

