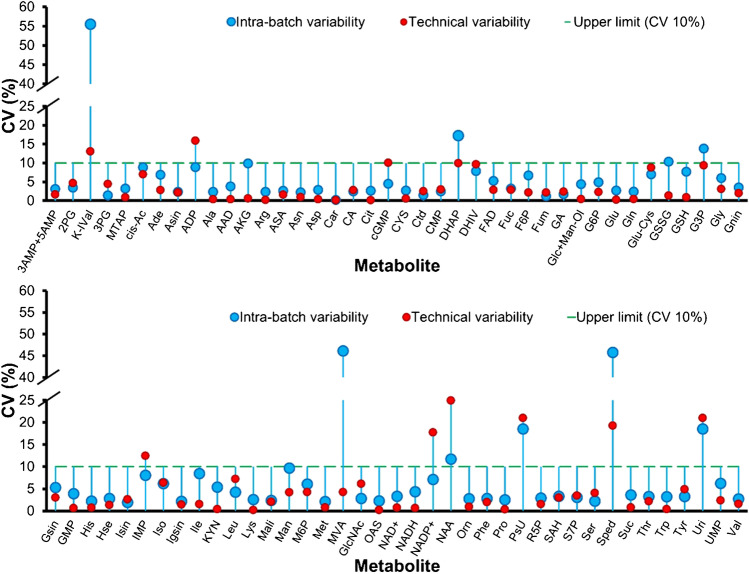
Fig. 3.
Homogeneity assessment of in-house yeast-based reference material for 78 investigated metabolites. Metabolites were measured using HILIC-HRMS and GC–MS/MS under positive and negative mode conditions. Quantification was based on external calibration with the addition of a fully 13C-labeled internal standard. For the individual metabolite, the black-filled circle represents the variability (% CV) of concentration values among different vials from the same batch (n = 6), and the unfilled circle represents technical variability of the measurement based on three consecutive injections from the same vial (n = 3) for LC–MS and four injections for GC–MS/MS (n = 4). The dashed line indicates the upper limit variability (CV 10%)

