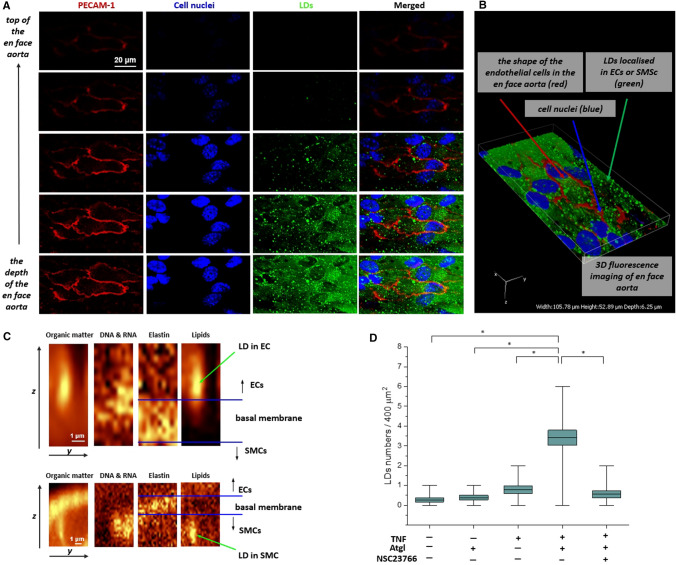
Fig. 2.
Localization of LDs in the aortic vascular wall in en face aorta stimulated by TNF in the presence of atglistatin. Confocal fluorescence microscopy z-stack images of fragment of en face aorta stimulated by TNF + Atgl (10 ng/ml and 10 µM, respectively, 48 h). Z stack images were acquired from the top to the depth of the en face aorta with 0.33-μm layer separation (A), and reconstructed as a 3D image (B). Red, blue and green fluorescence originate from PECAM-1 (stain: Cy3-antibody), cell nuclei (stain: Hoechst 33,258) and LDs (stain: BODIPY 493/503), respectively. 3D perspective Raman images of en face aorta showing the distribution of organic matter (integration in the 2800–3100 cm−1 range), DNA and RNA (778–808 cm−1), elastin (500–550 cm−1) and lipids (2830–2900 cm−1) in aorta stimulated by TNF + Atgl (C; 10 ng/ml and 10 µM, respectively, 48 h). Due to the presence of elastin fibres indicating the localization of the basal membrane, the population of LDs was separated into those LDs localised in the endothelium (C, upper panel), and LDs belonging to SMCs (C, lower panel). The calculations of number of endothelial LDs per one Raman image was performed (the typical size of Raman image 20 × 20 µm; D)

