Fig. 3.

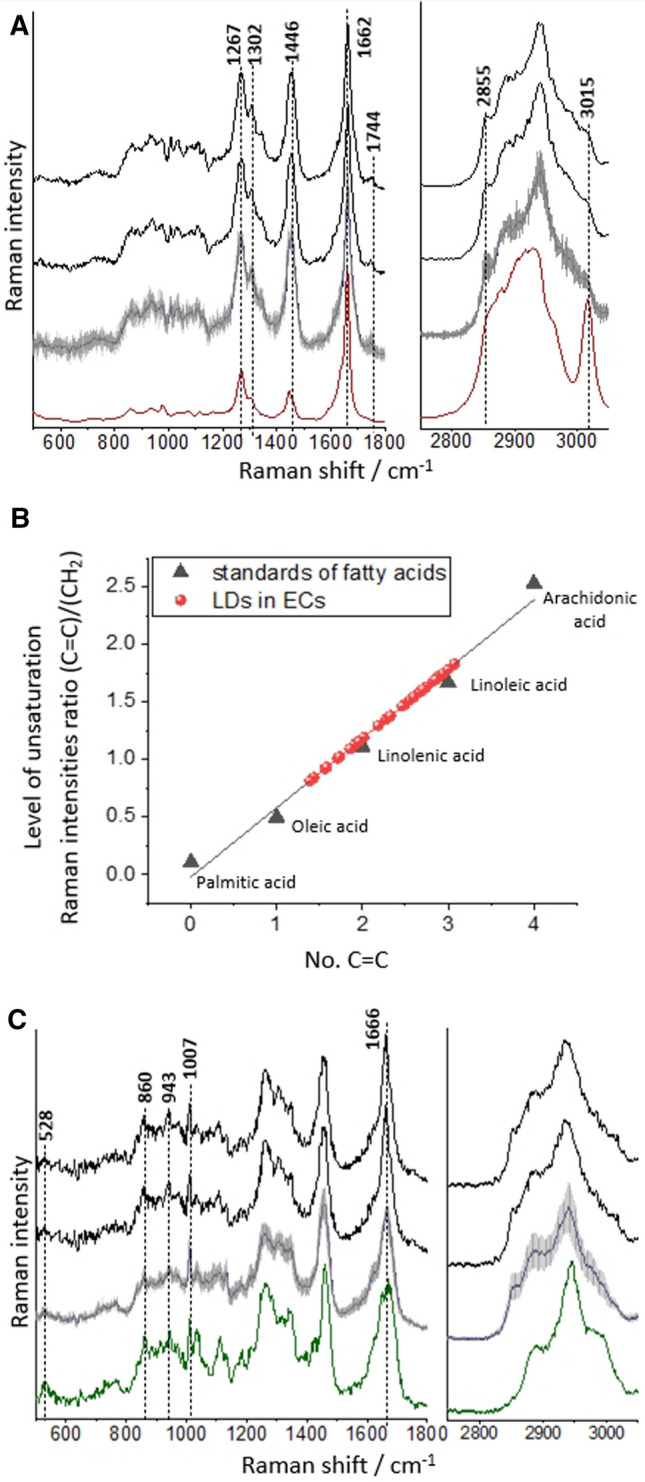
Chemical characterisation of LDs formed in the endothelium or in smooth muscle cells in en face aorta stimulated by TNF in the presence of atglistatin (10 ng/ml and 10 µM, respectively, 48 h). Representative Raman spectra of LDs extracted from ECs measured within the blood vessel (black spectra) and averaged over all measured cells (blue spectrum; spectrum presented with the standard error on each data point), with comparison to Raman spectrum of arachidonic acid (A; red spectrum). The calibration curve of fatty acids showing heterogeneity of individual level of unsaturation of endothelial LDs (B; representative Raman spectra of LDs extracted from SMCs measured within the blood vessel (black spectra) and averaged over all measured cells (blue spectrum; spectrum presented with the standard error on each data point), with comparison to Raman spectrum of elastin (C; green spectrum)
