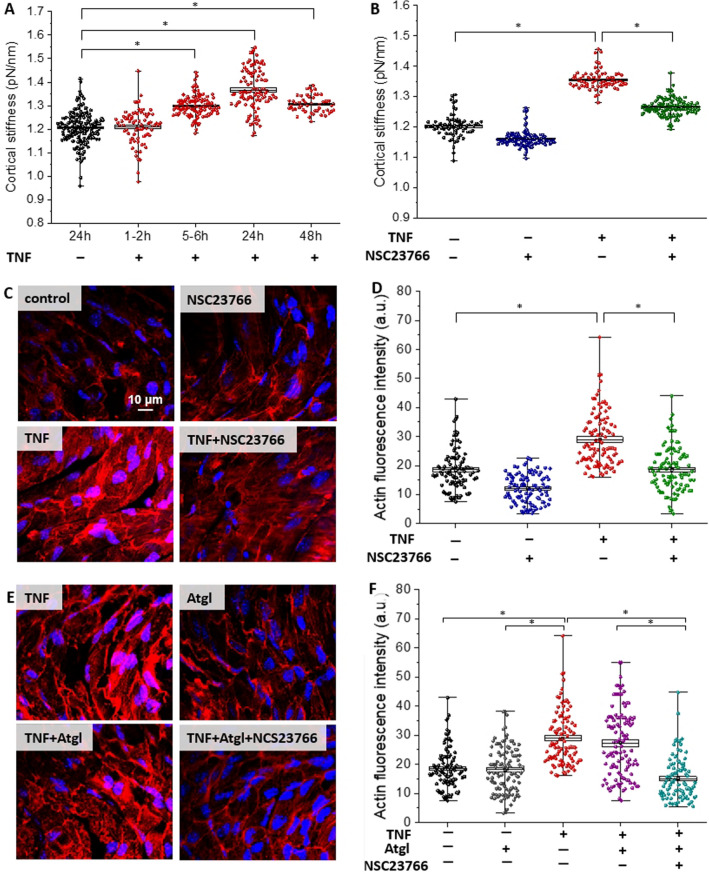
Fig. 4.
Changes in cortical stiffness and F-actin architecture in ECs in aorta en face stimulated by TNF. The time-dependent changes in the cortical stiffness of ECs stimulated by TNF (10 ng/ml) determined using AFM: control mice (N = 8, n = 160), and mice treated with TNF for 1–2 (N = 6, n = 118), 5–6 (N = 6, n = 118), 24 (N = 6, n = 101), or 48 h (n = 4, n = 52), respectively (A). Changes in cortical stiffness (B) of ECs within aorta stimulated by TNF (10 ng/ml, 24 h; N = 5, n = 70), and TNF in the presence of NSC23766 (TNF + NSC23766, 10 ng/ml and 50 µM, respectively, 24 h; N = 5, n = 135) in comparison to the control (N = 5, n = 72), and NSC23766 (50 µM; N = 5, n = 130). Representative microphotographs (C, E) of staining of control en face aorta (N = 3, n = 101), and aorta treated with NSC23766 (50 µM, 24 h; N = 3, n = 101), TNF (10 ng/ml, 24 h; N = 3, n = 98), TNF + NSC23766 (10 ng/ml and 50 µM, respectively, 24 h; N = 3, n = 102), Atgl (10 µM, 24 h; N = 3, n = 105), TNF + Atgl (10 ng/ml and 10 µM, respectively, 24 h; N = 3, n = 110), TNF + Atgl + NSC23766 (10 ng/ml, 10 µM and 50 µM, respectively, 24 h; N = 3, n = 92); red and blue fluorescence originating from F-actin (stain: phalloidin-TRITC) and cell nuclei (Hoechst 33,258), respectively. Quantification of F-actin fluorescence intensity of studied groups of samples (D, F). Values given as mean ± SD are shown in box plots: mean (horizontal line), SD (box), minimal and maximal values (whiskers)

