Fig. 6.
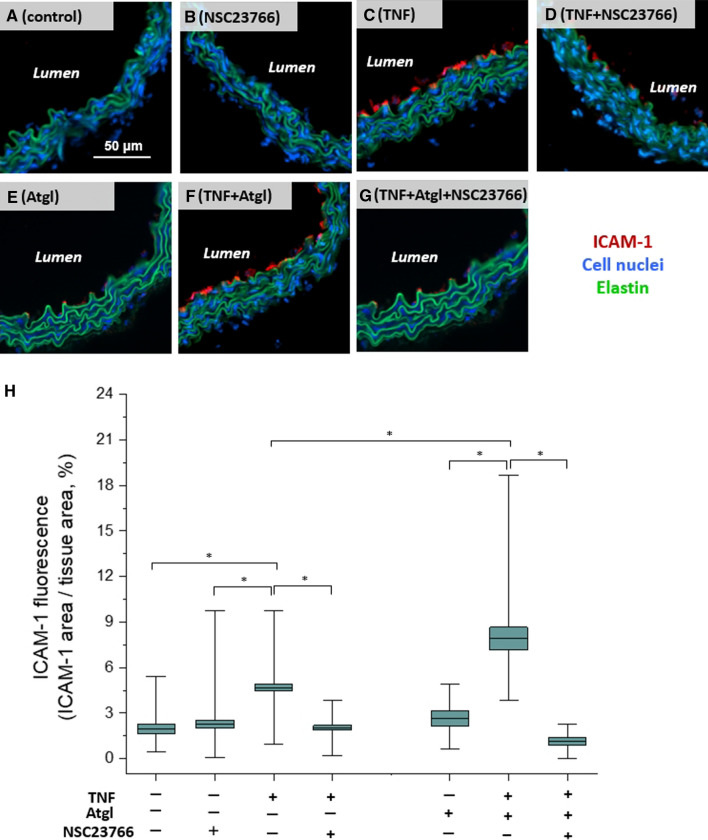
Expression of ICAM-1 in the cross section of aorta activated by TNF, in the absence and presence of NSC23766, or atglistatin. Representative microphotographs of ICAM-1 expression in cross section of control aorta (A), aorta treated with NSC23766 (B; 50 µM, 24 h), TNF (C; 10 ng/ml, 24 h), TNF + NSC23766 (D; 10 ng/ml and 50 µM, respectively, 24 h), atglistatin (E; 10 µM, 24 h), TNF + Atgl (F; 10 ng/ml and 10 µM, respectively, 24 h), and TNF + Atgl + NSC23766 (G; 10 ng/ml, 10 µM and 50 µM, respectively, 24 h). Red, blue, and green fluorescence originate from ICAM-1 (stain: Cy3-antibody, cell nuclei (stain: Hoechst 33258), and elastin fibres (autofluorescence), respectively. Quantification of ICAM-1 expression of studied groups of samples, presented as the ratio of positively-stained ICAM-1 area to the total area of the tissue (H). Values given as mean ± SD are shown in box plots: mean (horizontal line), SD (box), minimal and maximal values (whiskers)

