Fig. 3.
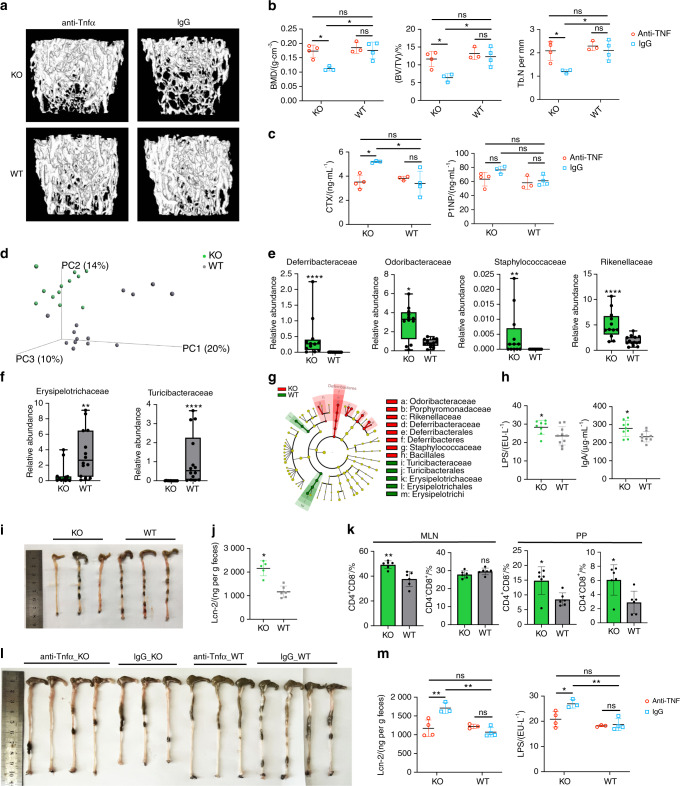
The anti-TNFα therapy experiment and the altered gut microbiota composition and intestinal inflammation in TLR9−/− mice. a–c, l, m The anti-TNFα therapy experiment. In all panels, n = 3 in IgG_KO and anti-TNFα_WT group; n = 4 in anti-TNFα_KO and IgG_WT group. a Representative 3D μCT reconstructions of femurs from each group. b Trabecular BMD, BV/TV, and Tb. N of femurs in each group. c Serum CTX and P1NP levels. d 3D PCoA of 16S rRNA sequencing of fecal microbiota from 8-week sex-matched TLR9−/− (KO) and wildtype (WT) mice. Each dot represents a fecal microbiota from one mouse. KO, n = 12; WT, n = 14. e–f Relative abundance of the significantly upregulated families (P < 0.05) in KO (e) and WT (f) group. Boxplots represent median and quantiles. g Cladogram of Linear discriminant analysis Effect Size (LEfSe) analysis showing the differentially abundant bacteria between KO and WT groups. h Circulating LPS and IgA levels. n = 8–10 per group. i Large intestines of 8-week-old male KO and WT mice. j Fecal Lcn-2 levels. KO, n = 5; WT, n = 6. k Flow cytometry analysis of T cell populations in MLN and PP. n = 6 per group. The numbers represent the frequencies in total MLN or PP cells. l, m Ameliorated gut inflammation after anti-TNFα therapy. l Large intestines from all treated mice. m Serum LPS and fecal Lcn-2 levels. Mann–Whitney t test was used in e and f. Two-way ANOVA with multiple comparisons (Turkey’s test) were used in b, c and m. An unpaired two-tailed t-test was applied in other panels. Error bars represent the s.d. *P < 0.05, **P < 0.01, ****P < 0.000 1 and ns P > 0.05

