Fig. 7.
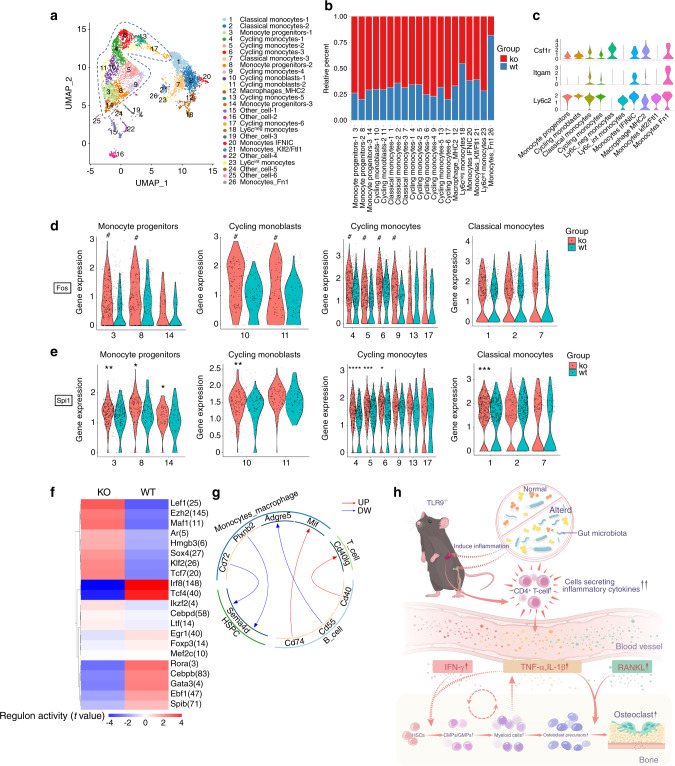
scRNA-seq mapping of bone marrow monocyte/macrophages and T cells. a–e Mapping of monocyte/macrophages. a The reclustered monocyte/macrophages (pool of cluster 5, 11, 15, 21, 27 in Fig. 5a). The immature monocytes are circled with a blue dotted line. b Relative percentages of KO and WT cells in each subcluster. X axis represents cluster number and cell type. c Expression of OCP markers in different cell types. Clusters of the same cell types in a were combined for analysis. d, e Differences of Fos (d) and Spi1 (e) expression between KO and WT cells in the indicated subclusters. X axis represents subcluster numbers. In d, the pound sign means significant difference in average expression of Fos with P < 0.05 and fold change > 1.5. f, g. Analysis of bone marrow T cells. f SCENIC analysis reveals differences of the regulon activities between TLR9−/− (KO) and wildtype (WT) cells in total T cells. g Ligand-receptor predictions among indicated cell types. Red and blue arrows show the upregulated and downregulated ligand-receptor pairs in KO cells, respectively. h Proposed model for the mechanism of osteoclastic bone loss in TLR9−/− mice. The TLR9−/− mice exhibit a low-grade systemic inflammation derived from the altered gut microbiota. The systemic inflammation features expansion of CD4+ T cells and increased inflammatory cytokines. These cytokines not only stimulate OCPs to differentiate into osteoclasts, but also increase the pool of OCPs by promoting the myeloid-biased hematopoiesis. The dual effect of the inflammatory cytokines significantly promote osteoclastogenesis and bone loss in TLR9−/− mice. Furthermore, increased myeloid cells may also contribute to the maintenance of the chronicity of inflammation, resulting in a feed-forward loop. In d and e, the asterisks mean significant difference in average gene expression. Wilcoxon test was used to determine the significance in d and e. *P < 0.05, **P < 0.01, ***P < 0.001 and ****P < 0.000 1

