Figure 5.

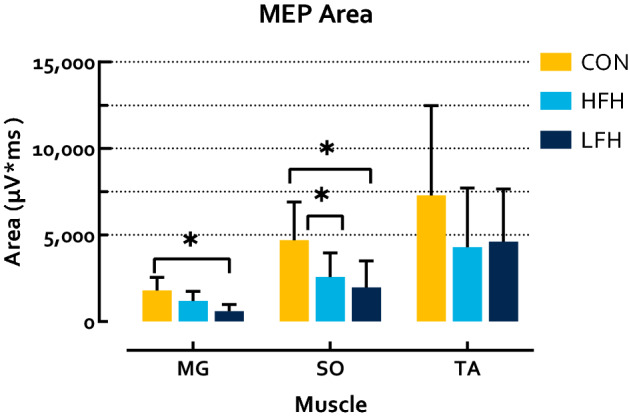
MEP Area in response to TMS during walking. CON exhibited greater MEP area than LFH individuals in the MG, as well as LFH and HFH individuals in the SO. No differences were observed in the TA. Asterisks denote a p < 0.05.

MEP Area in response to TMS during walking. CON exhibited greater MEP area than LFH individuals in the MG, as well as LFH and HFH individuals in the SO. No differences were observed in the TA. Asterisks denote a p < 0.05.