
Figure 6.
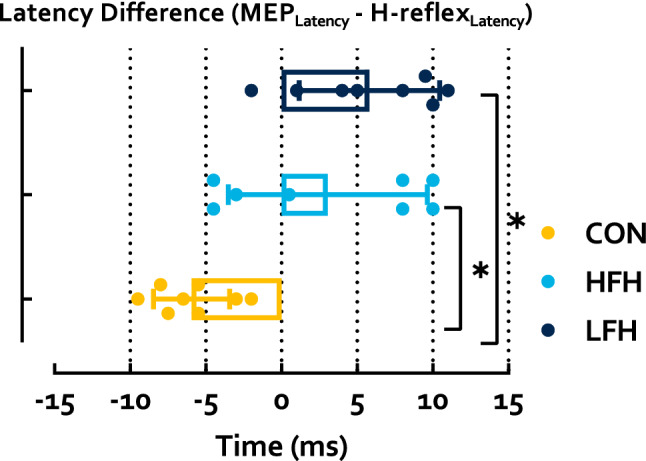
Latency difference derived using SO MEP latency and H-reflex latency. This relationship was significantly more negative in CON than LFH or HFH, while LFH and HFH did not differ. Asterisks represent a p < 0.05.
Official websites use .gov
A
.gov website belongs to an official
government organization in the United States.
Secure .gov websites use HTTPS
A lock (
) or https:// means you've safely
connected to the .gov website. Share sensitive
information only on official, secure websites.
Latency difference derived using SO MEP latency and H-reflex latency. This relationship was significantly more negative in CON than LFH or HFH, while LFH and HFH did not differ. Asterisks represent a p < 0.05.