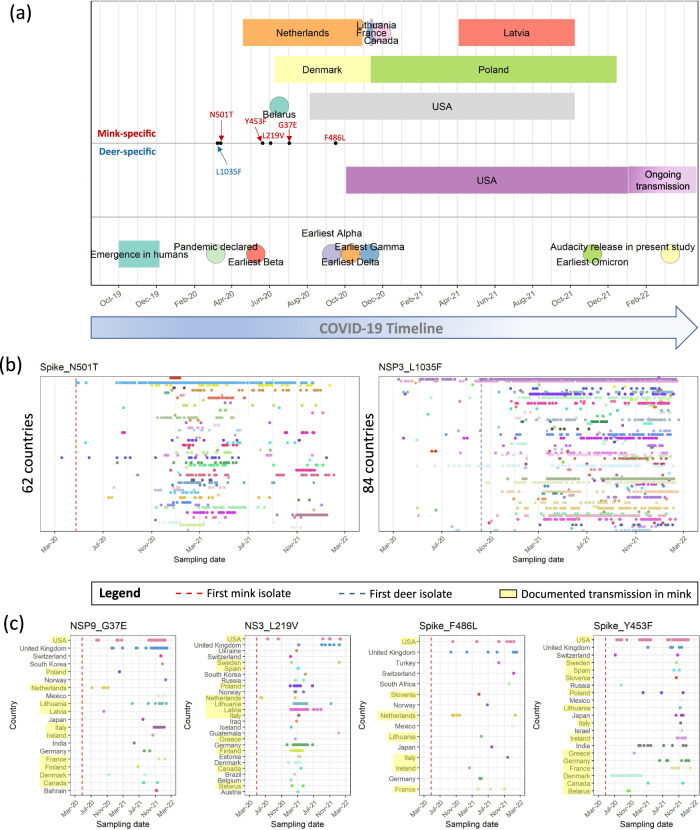
Fig. 3. Timeline of the COVID-19 pandemic.
a The key events of the pandemic from the estimated emergence of SARS-CoV-2 in humans3 to the sampling dates of the first isolates for each VoC are annotated in the lowest panel. The coloured rectangles in the upper first and second panels indicate the range of sampling dates of animal-associated SARS-CoV-2 sequences in the different countries. The sampling dates of the earliest human isolates carrying each candidate mutation are annotated along the timeline are indicated by black points. Panels b and c show the temporal distributions of candidate mutations in human SARS-CoV-2 isolates collected prior to 17th March 2022. Red and blue dashed lines indicate the sampling date of the first mink-associated isolate in the Netherlands and deer-associated isolate in the USA, respectively. For panel b, country names were omitted, and the number of countries where the candidate mutations were found in human isolates are annotated. For panel c, countries where human-to-mink transmission has been documented are highlighted in yellow41.

