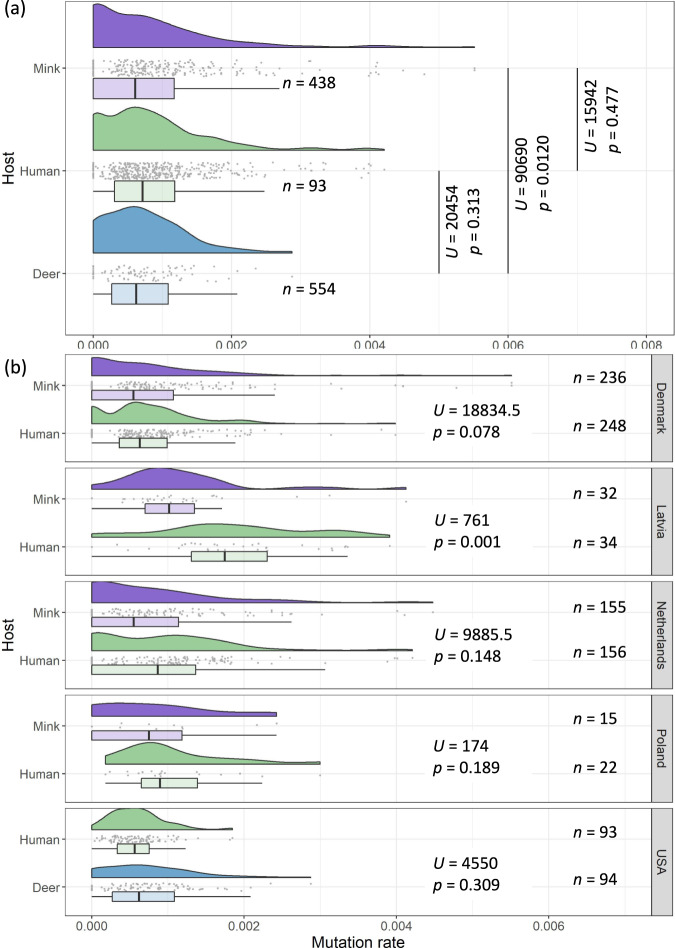
Fig. 5. Host-specific substitution rate variation.
Raincloud plots95 of terminal branch lengths stratified by a host, and b by both host and country. These plots comprise Gaussian kernel probability density, scatter and box-and-whisker plots (centre line, median; box limits, upper and lower quartiles; whiskers, 1.5x interquartile range). Multiple mink-human maximum-likelihood phylogenies of mink and human background 1 isolates were reconstructed and used for tip-calibration. Isolates that did not have complete dates or that were duplicate sequences were removed prior to analysis. The final number of isolates in each stratum that were used for tip-calibration, Mann–Whitney U-statistics and their associated p-values (based on a two-sided test), are annotated.

