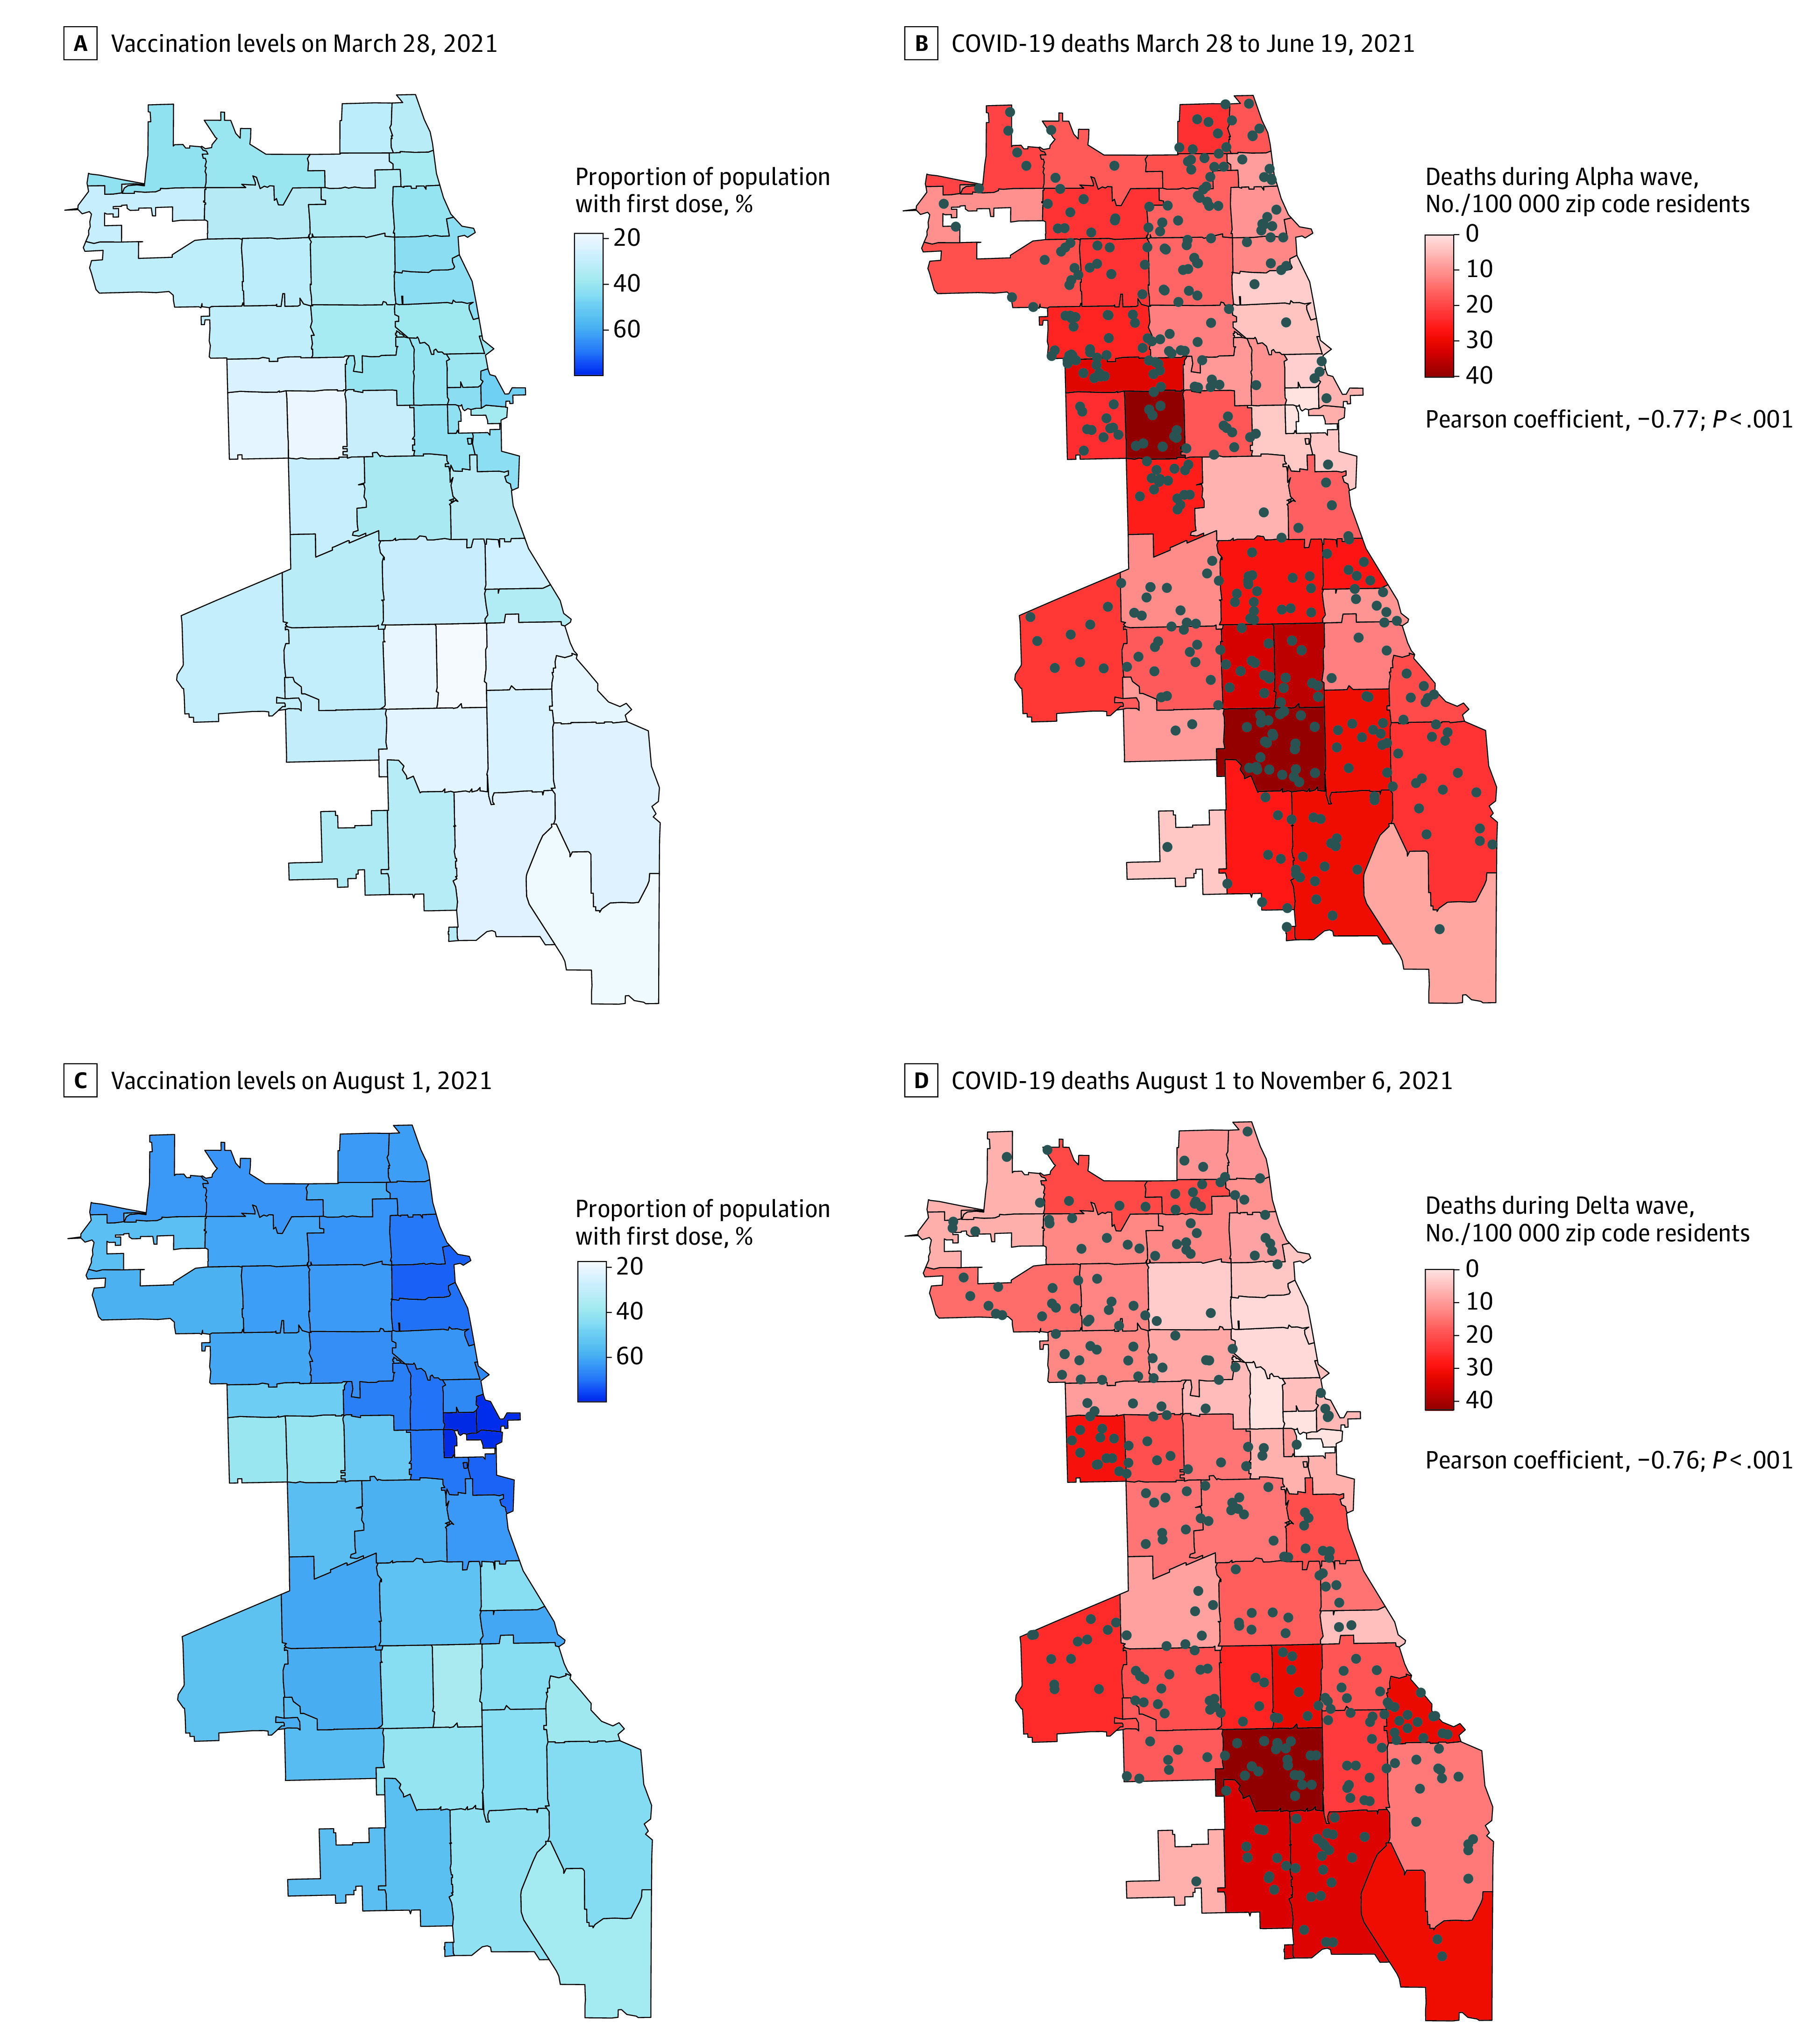
Figure 1. Geographic Distribution of Prewave Vaccination Coverage and Mortality.

Individual deaths recorded by Cook County Medical Examiner are shown in dots. Unadjusted Pearson product-moment correlation coefficient between prewave vaccination coverage and total mortality was weighted by zip code population. The P value was obtained from a t test for significance with a null hypothesis of no correlation (r = 0) and bootstrapped SEs.
