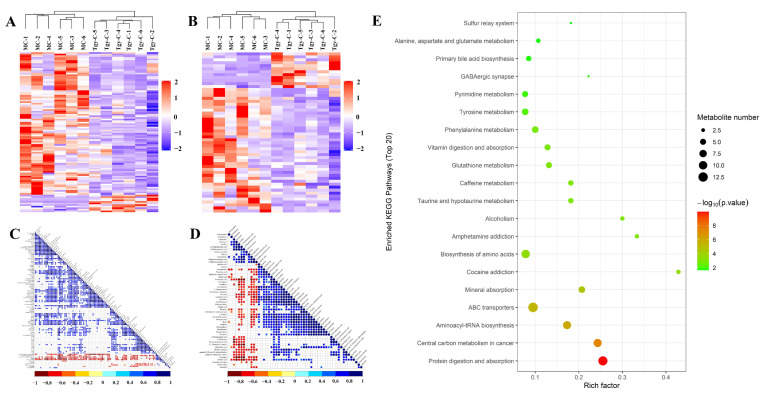
Figure 6.
Clustering of the differential metabolites between Tgy-C and MC groups and the results of KEGG enrichment. The differential metabolites between Tgy-C and MC groups were clustered in positive (A) and negative (B) ion modes. The differential metabolites in positive (C) and negative (D) ion modes were used for correlation analysis, and all the involved metabolites were enriched based on KEGG database (E).

