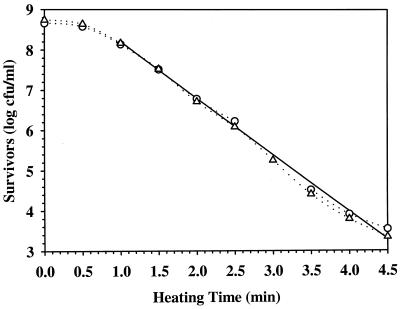
FIG. 1.
Thermal inactivation curve of TSB-grown Pediococcus cells in tap water at 60°C. Circles and triangles represent the data of two independent studies. The solid straight line is the average regression plot of the straight portion of the two survivor curves (dotted lines). Cells were grown to ME at 28°C, washed once with sterile distilled water, and suspended in tap water to ca. 8 log CFU/ml.

