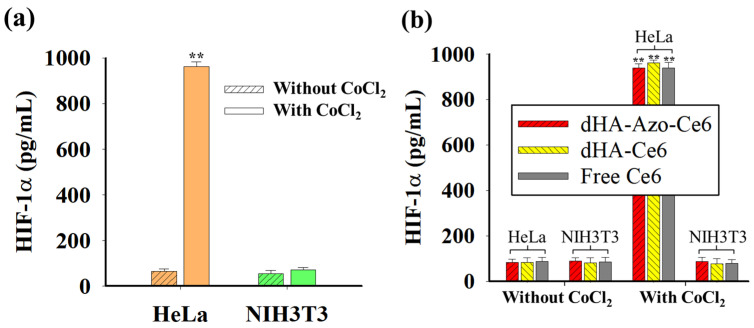
Figure 4.
(a) HIF-1α expression levels in cells (HeLa and NIH3T3) with or without CoCl2 treatment (n = 3, as multiple experiments, ** p < 0.01 compared to HeLa cells without CoCl2). (b) HIF-1α expression levels in HeLa and NIH3T3 cells treated with each sample (10 μg/mL equivalent of Ce6) or free Ce6 (10 μg/mL) before and after CoCl2 treatment (n = 7, as multiple experiments, ** p < 0.01 compared to HeLa or NIH3T3 cells without CoCl2).

