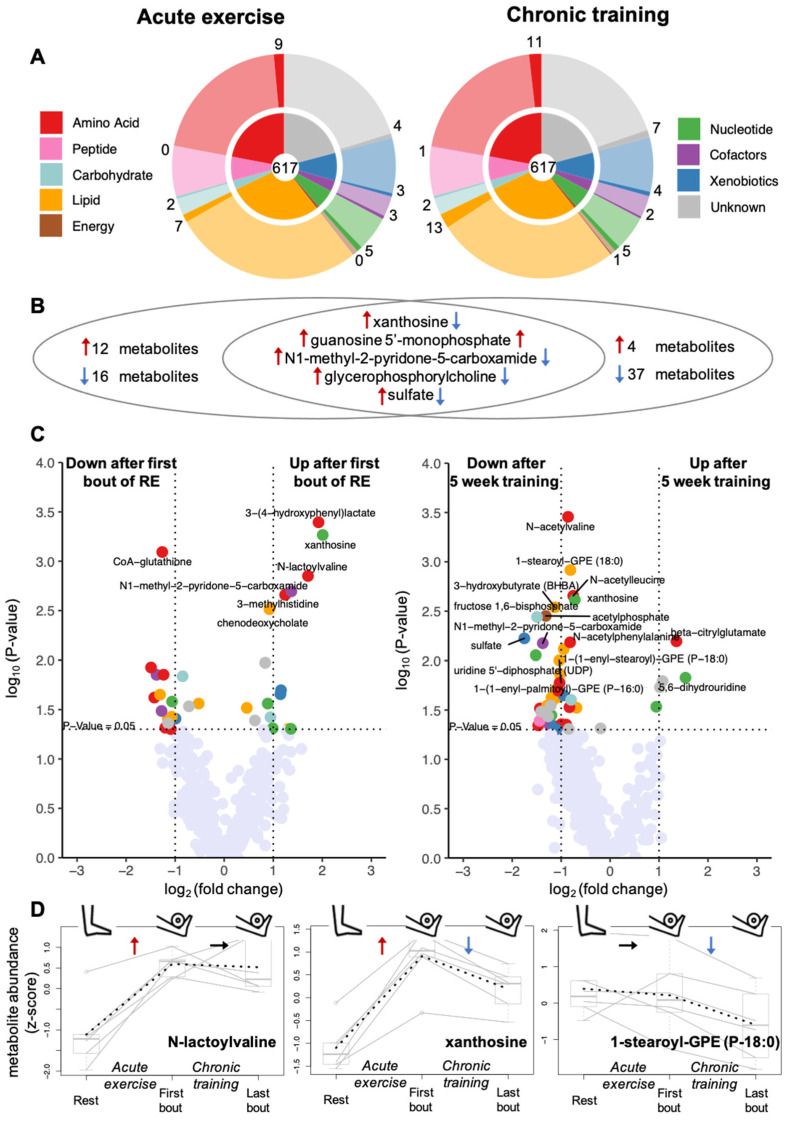
Figure 3.
Effects of acute exercise and chronic training on muscle metabolome. (A) The 617 analysed metabolites belong to nine different metabolite classes; the inner circles of the pie charts show the fraction of metabolites falling into each class; the fraction of affected metabolites (p < 0.05) per class is marked by saturated colour in the outer rings. (B) In total, acute exercise (i.e., comparing metabolite levels after first bout of exercise with levels at rest) and chronic training (i.e., comparing levels after last bout of exercise after 5 weeks training with levels after first bout of exercise) showed an effect on 33 (left) and 46 (right) metabolites, respectively, with 5 metabolites being changed in response to both conditions (middle); red arrows indicate an increase, blue arrows a decrease in metabolite levels. (C) Volcano plots displaying the p-values (−log10) versus log2 fold changes of all metabolites after acute exercise (left) and after chronic training (right); metabolites with p < 0.05 are shown in the color of their metabolite class using the same color coding as in A. (D) Metabolite levels for all 6 participants at the three sampling points shown for three selected metabolites with typical patterns of changes after acute exercise (N-lactoylvaline; left), chronic training (1-stearoyl-GPE (P-18:0); right), and both conditions (xanthosine; middle), respectively; solid lines connect the levels of each individual; dotted lines connect the mean levels at each sampling time point.

