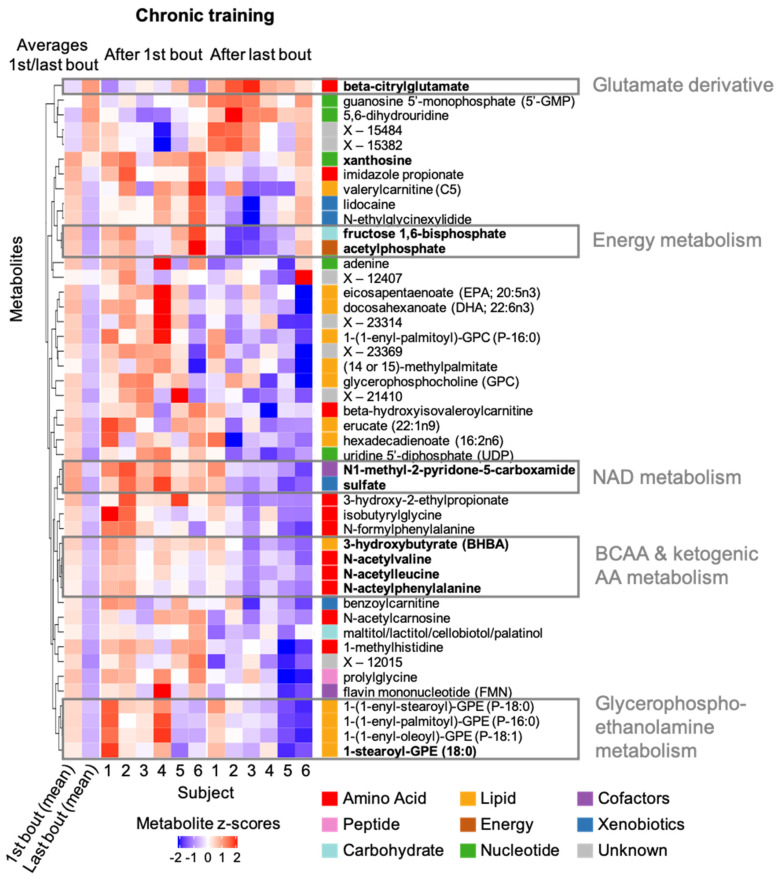
Figure 5.
Heatmap of metabolites changing in response to chronic training. Individual and average metabolite levels after the first bout of exercise and after the last bout of exercise following five-week resistance training are shown as z-scores for all 46 metabolites with changes (p < 0.05) in response to chronic training; red color indicates higher levels compared to all levels measured for the specific metabolite in the present study; analogously, blue color indicates lower levels; names of metabolites with significant changes after correcting for multiple testing are shown in bold. Metabolites were clustered by their similarity in metabolite levels at the two conditions across the participants; the resulting clusters are displayed in the dendrogram on the left of the heatmap. Selected clusters and their link to exercise-related molecular processes are highlighted. BCAA: branched chain amino acid; AA: amino acid; NAD: nicotinamide adenine dinucleotide.

