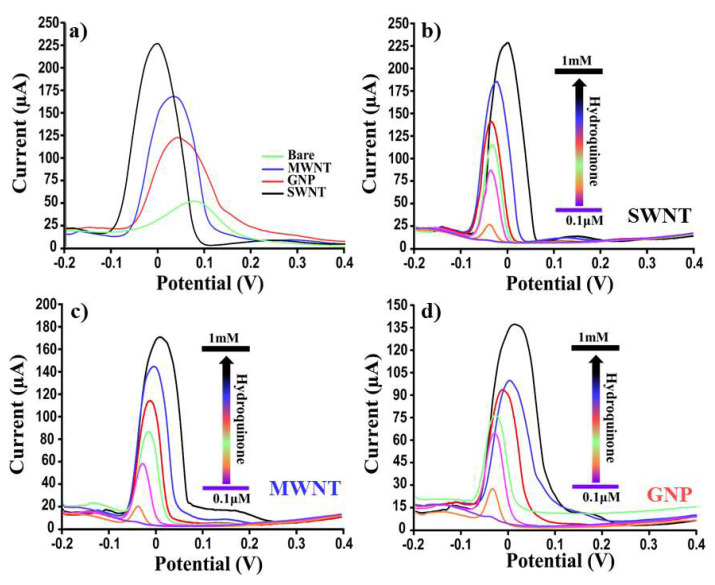
Figure 6.
Dose–response voltammograms. Comparison of the SWVs for different platforms (SWNTs, MWNTs, GNPs, and bare SPEs) (a) at the same concentration of HQ (10 mM) and (b–d) at several HQ concentrations (from 0.1 to 1 mM). Curves of one representative CNM-modified SPE sensor of at least 6 analyzed platforms are presented.

