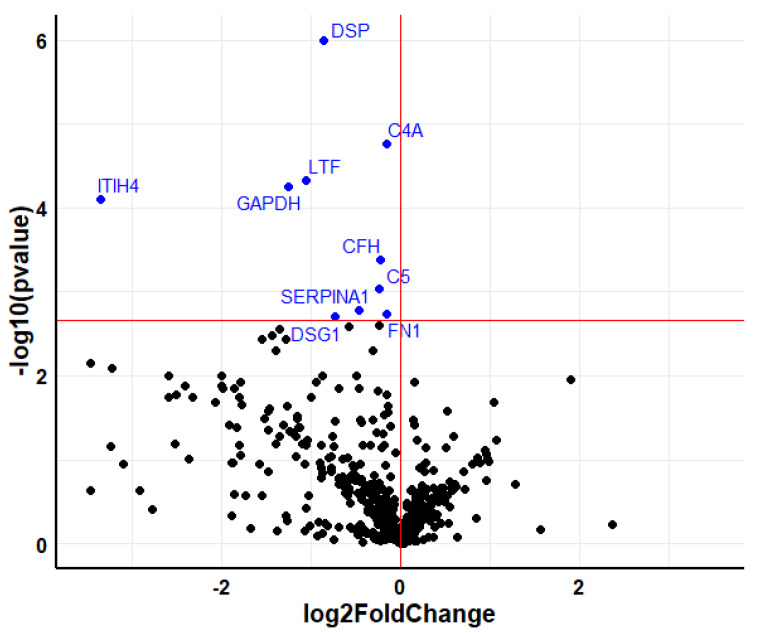
Figure 4.
Volcano plot showing the differentially expressed proteins in serum after 6-month treatment with denosumab. The downregulated proteins are colored in blue. Horizontal red line marks the q-value threshold (0.05). Black circles are those proteins under the q-value threshold (not significant).

