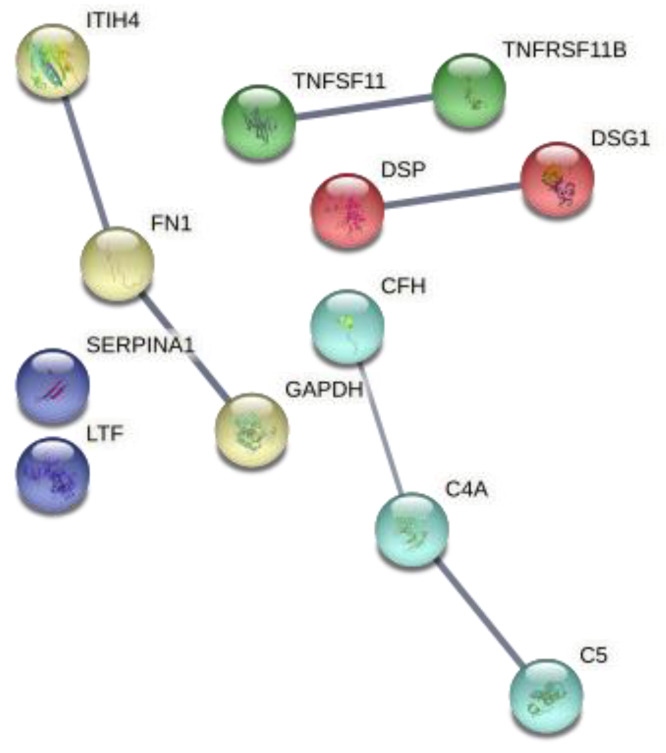
Figure 5.
Protein–protein interaction network of the differentially expressed proteins after 6-month therapy with denosumab. The edges show protein–protein interactions with predicted functional partners. Edges have different colors according to their clustering with k means with input number 5. All lines represent known protein–protein interactions with high confidence.

