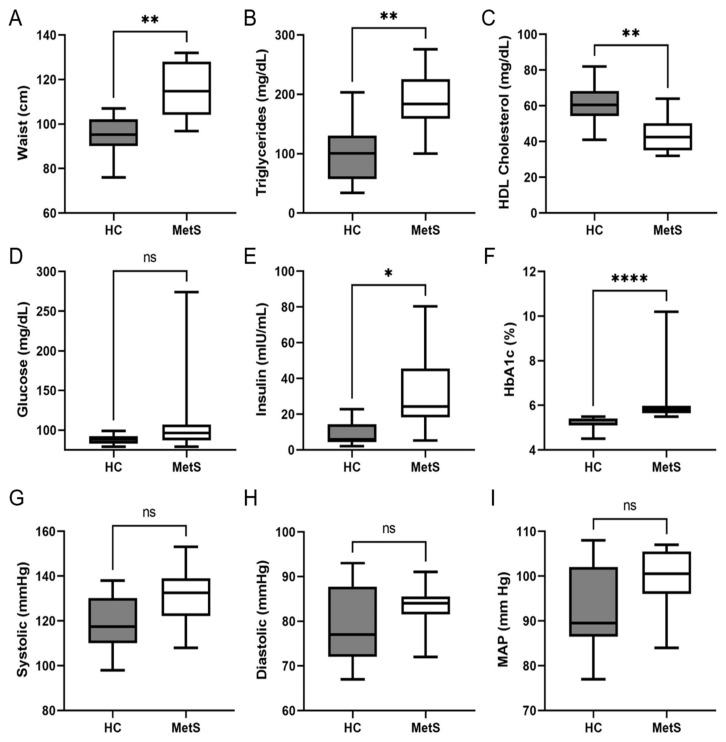
Figure 1.
Metabolic Syndrome risk factors. Clinical and biochemical analysis of healthy controls (HC) and metabolic syndrome (MetS) participants. Graph showing (A) abdominal obesity (i.e., waist circumference); (B) triglyceride levels; (C) HDL Cholesterol; (D) fasting glucose levels; (E) fasting insulin levels; (F) hemoglobin A1c (HbA1c) levels; (G) systolic blood pressure; (H) diastolic blood pressure; and (I) mean Arterial Pressure (MAP). Graphs indicate median (±minimum and maximum). * p < 0.05, ** p < 0.01, **** p < 0.0005 and ns, not significant. Two-tailed unpaired Student’s t-tests (A–C,G–I) or two-tailed Mann–Whitney U (D–F).

