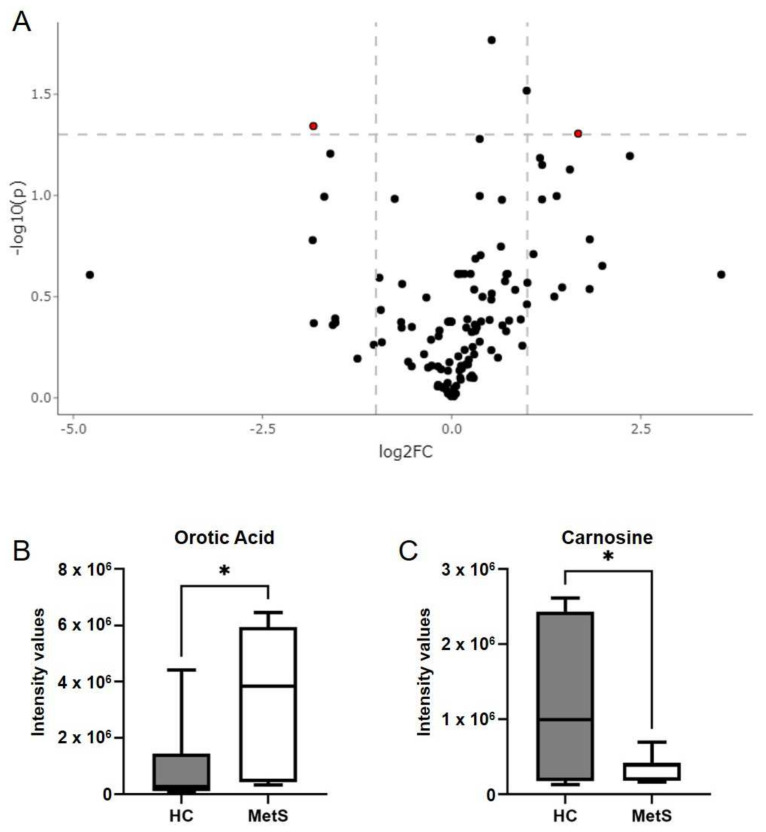
Figure 4.
Hybrid metabolomics of stool samples. (A) Volcano plot from hybrid LCMS assays of stools from MetS and HC subjects (n = 7–10/group) depicting a standard panel of approx. 150 polar metabolites. Each dot represents one metabolite, dashed lines indicate default thresholds for significance (p < 0.05) and fold change up- or down-regulation by 2-fold ([Log2FC] = 1). The red dot on the right represents a metabolite with higher levels in MetS participants, while the dot on the left is a metabolite with lower levels in MetS in respect to HCs. Plot showing the intensity values of fecal (B) orotic acid and (C) carnosine in MetS and HC participants. Plots indicate median (±minimum and maximum). * p < 0.05. Two-tailed unpaired Student’s t-tests.

