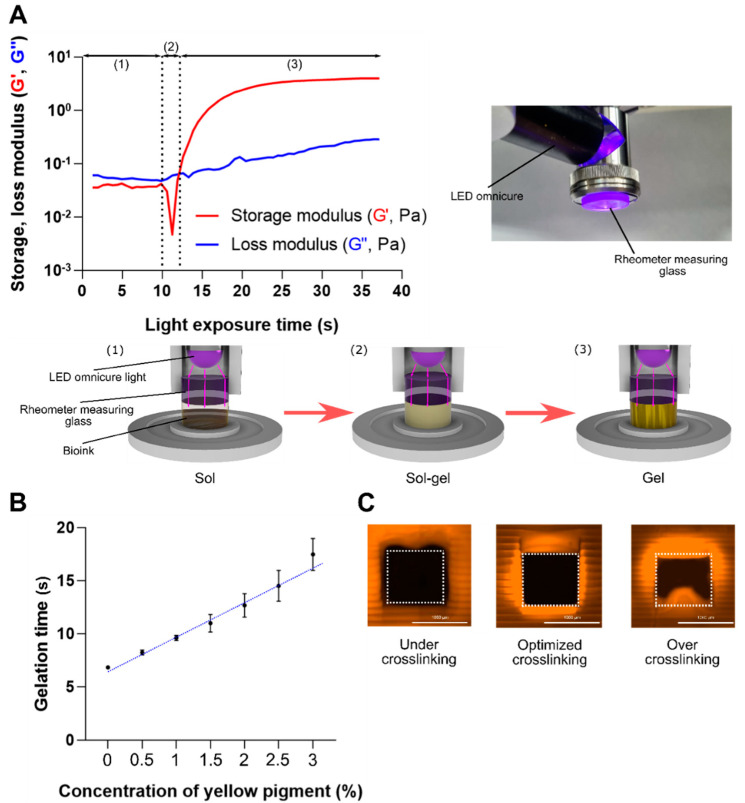
Figure 3.
(A) Representative photorheological analysis graph of sol-gel phase change (storage modulus (G′) and loss modulus (G″)) and schematic diagram describing the photorheological measurement process. Region (1), biomaterial ink is in liquid (sol) phase; region (2), some biomaterial ink starts to form aggregate; region (3), gel phase. (B) Gelation time graph of the yellow photoabsorber concentrations (0, 0.5, 1, 1.5, 2, 2.5, and 3%). Data are shown as the mean ± SD, n = 3. (C) Results of under-crosslinked (9 s), optimized (11 s), and over-crosslinked (13 s) printed samples. Scale bar = 1000 μm.

