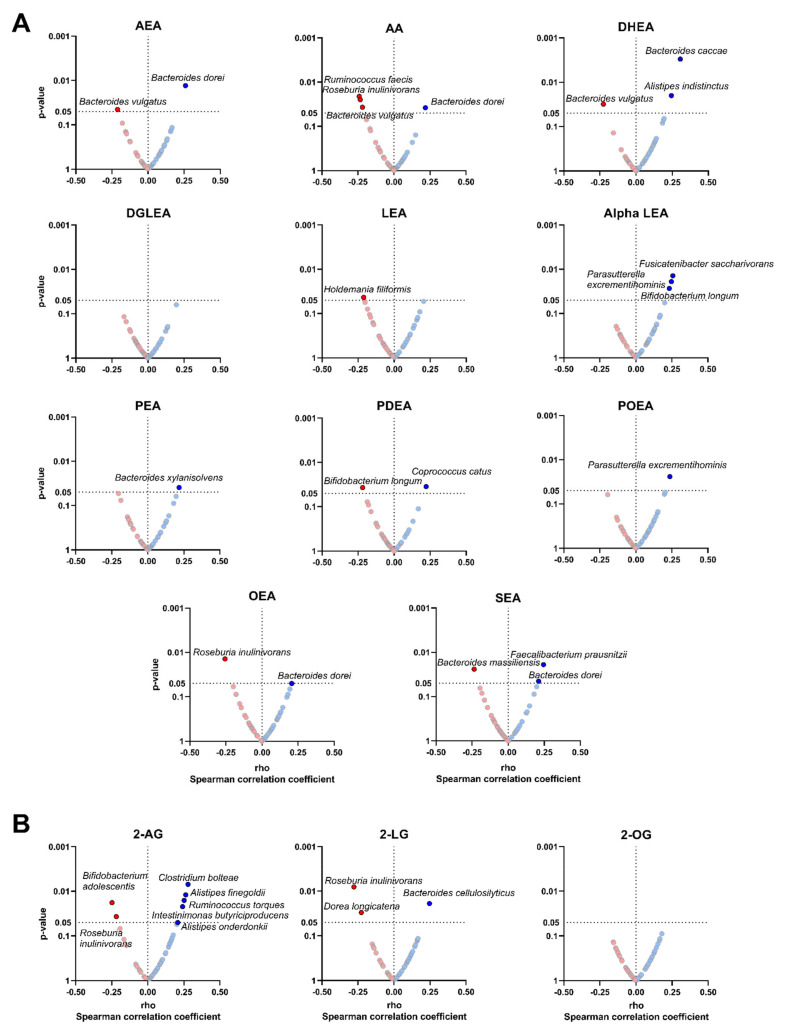
Figure 3.
Volcano plots showing partial Spearman correlations of plasma levels of endocannabinoids and their analogues with the relative abundance of certain bacterial species. Each volcano plot shows the rho coefficients in the X-axis, and p-values of the correlations are shown on the Y-axis. Panel (A) shows AEA and related N-acylethanolamines, whereas panel (B) shows 2-AG and related acylglycerols. Red circles indicate negative correlations, whereas blue circles indicate positive correlations. Body mass index was included as a confounder in these correlations. Only those bacterial species with significant p-values (p < 0.05) are annotated within the figure. 2-AG: 2-arachidonylglycerol; 2-LG: 2-linoleoylglycerol; 2-OG: 2-oleoylglycerol; alpha LEA: alpha-Linolenoyl ethanolamide; AA: arachidonic acid; AEA: anandamide; DGLEA: dihomo-gamma-linolenoyl ethanolamide; DHEA: docosahexaenoyl ethanolamide; LEA: linoleoyl ethanolamide; OEA: oleoyl ethanolamine; PEA: palmitoyl ethanolamide; PDEA: pentadecanoyl ethanolamide; POEA: palmitoleoyl ethanolamide; SEA: stearoyl ethanolamide.

