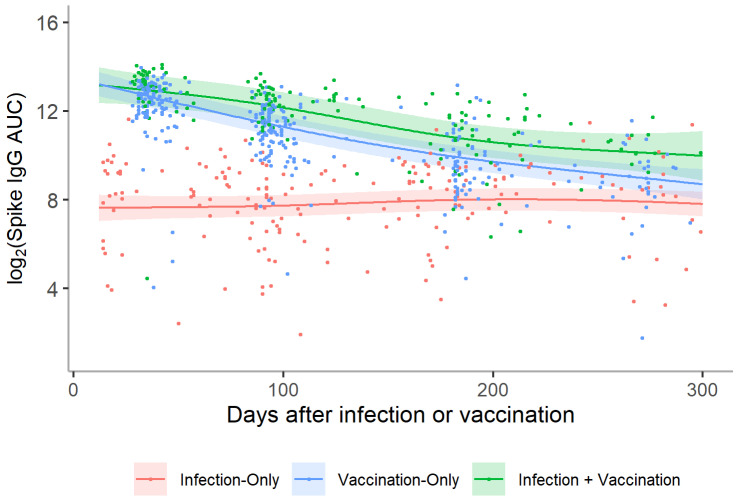
Figure 2.
Log2 anti-spike IgG titers over time for participants in the infection-only, vaccination-only, and infection + vaccination groups. A distinct smoothing function was fit for paired samples from the infection-only (n = 201), vaccination-only (n = 346), and infection + vaccination (n = 162) groups using a generalized additive model (GAM). The figure represents the mean trajectory for each group marginalized over age and sex. A random intercept was also included to account for repeated measures within individuals. The two vaccine groups displayed higher titers soon after infection/vaccination compared with the infection-only group, gradually decreasing until beginning to approach the titer levels of the infection-only group approximately 300 days post-infection/vaccination.

