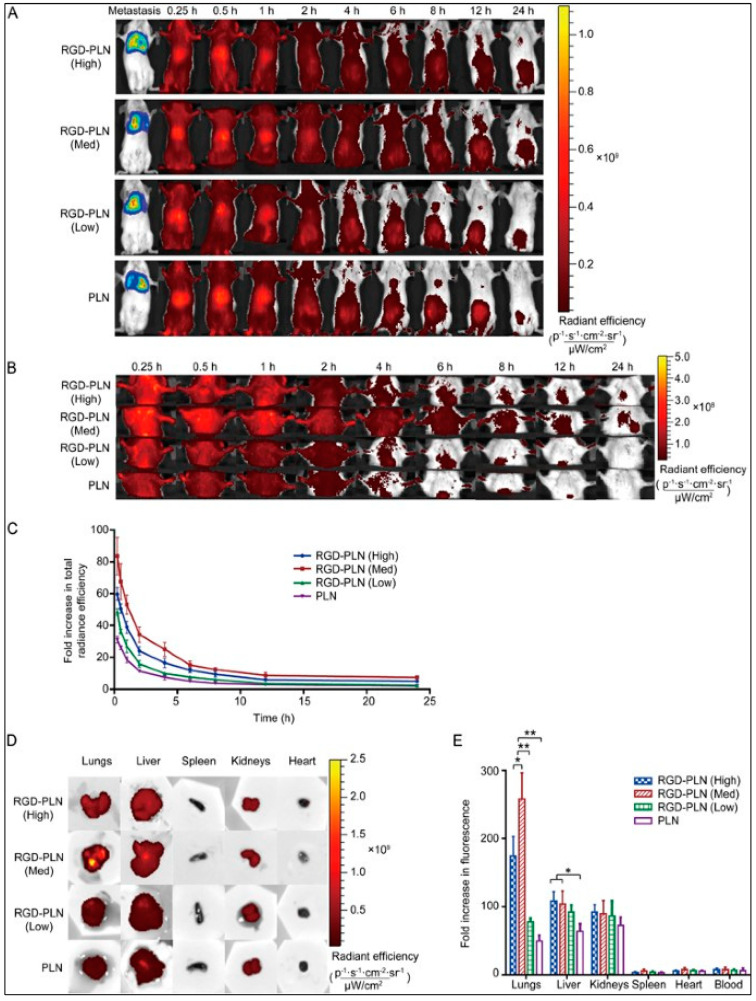
Figure 8.
Fluorescent imaging of ICG labeled DOX-MMC-NP biodistribution in the MDA-MB 231-luc-D3H2LN lung metastasis SCID model of TNBC. (A) Biodistribution images of the whole body upto 24 h through Xenogen IVIS Spectrum System 100 with Ex: 745 nm and Em: 820 nm. (B) Magnified images of NPs accumulation in the lungs for 24 h. (C) A quantitative representation of DOX-MMC-NP biodistribution in lung metastatic region up to 24 h. (D) Qualitative representation of DOX-MMC-NP biodistribution in various organs ex vivo for 4 h. (E) Quantitative representation of DOX-MMC-NP biodistribution in various organs ex vivo for 4 h (* p < 0.05, ** p < 0.01). This work is licensed under the Creative Commons Attribution-Non-Commercial-No Derivative Works 3.0 Unported License. http://creativecommons.org/licenses/by-nc-nd/3.0/ (accessed on 14 June 2021). This work is attributed to ref. [270].

