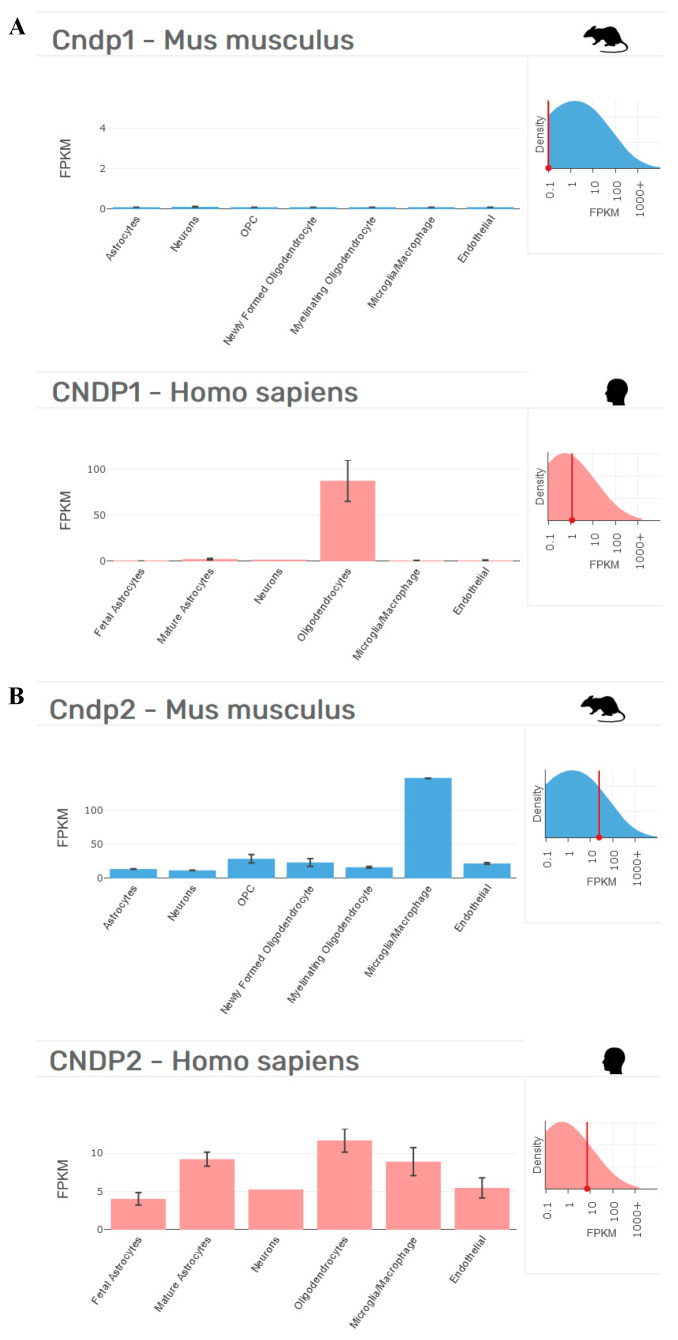
Figure 2.
Cellular distribution in the brains of Mus musculus and Homo sapiens of (A) CNDP1 and (B) CNDP2, according to transcriptome studies [131,132]. Fragments per kilobase of transcript per million mapped reads (FPKM) data collected from http://www.brainrnaseq.org on 17 April 2022.

