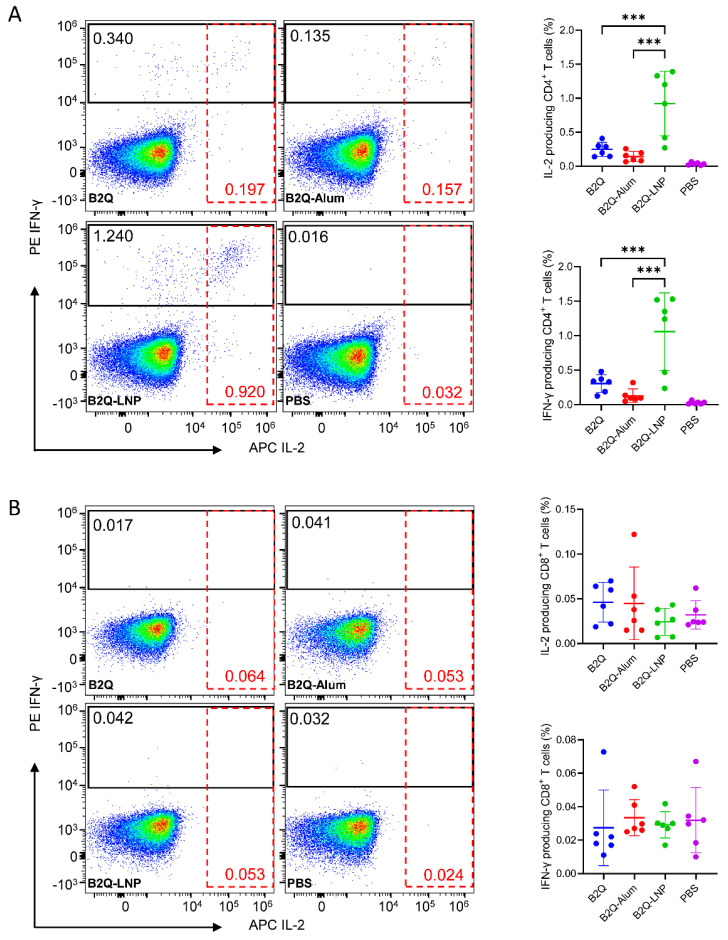
Figure 7.
Flow cytometry assay assessing cytokine-producing gE-specific CD4+ (A) and CD8+ (B) T cells in mice in the LNP encapsulation study. Splenocytes from immunized mice were treated with 10 μg/mL protein gE, and after blocking with brefeldin A, IL-2- and IFN-γ-producing CD4+ (A) or CD8+ (B) T cells were detected. Pseudocolor images displaying representative results near the average value are presented in the left panel. N = 6, points represent individual mice. Data are shown as the mean and SD and were analyzed by ANOVA, with the mean of the B2Q-LNP group used as a control. *** p ≤ 0.001.

