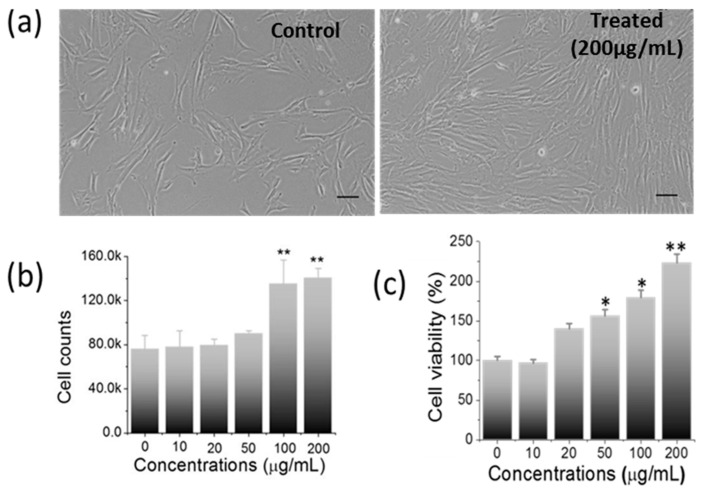
Figure 3.
Impact of nanosheet treatment on cellular behavior. (a) Phase-contrast micrographs showing normal fibroblast-like morphology in treated hWJ-MSCs with an enhanced proliferation at 200 µg/mL than control (Scale bar: 50 µm), (b) Graph showing ≈2-fold enhanced cell count in treated cells vs. control cells, (c) Significant increase in cell viability analyzed by MTT assay. (* p-value < 0.05; ** p-value < 0.001).

