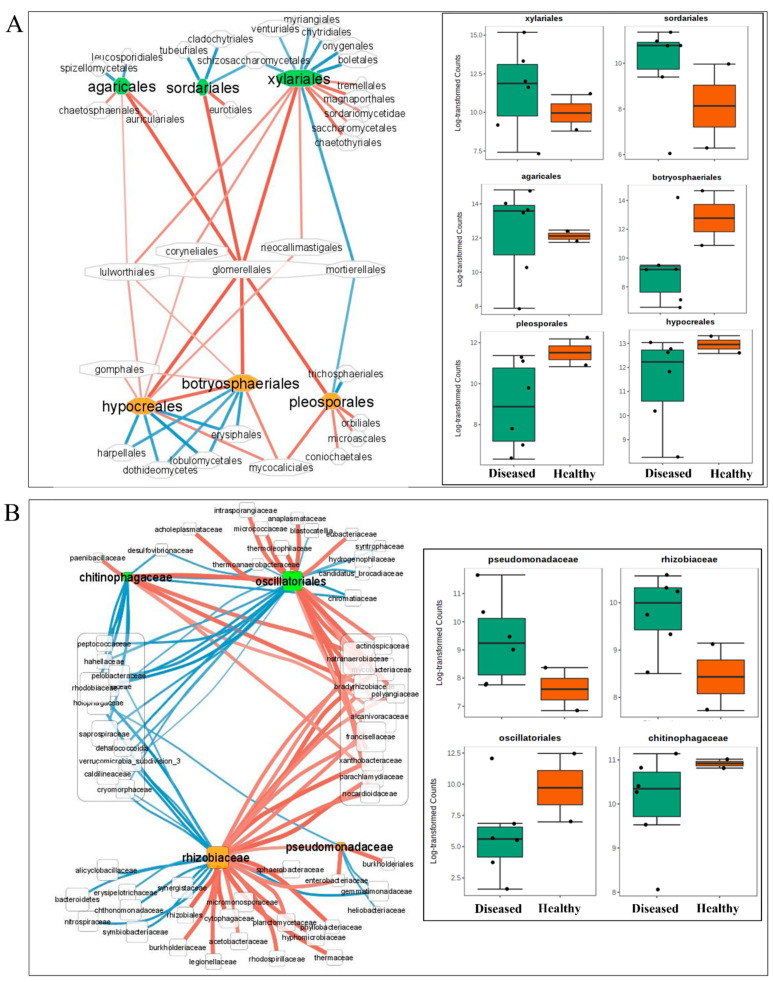
Figure 7.
Inference of taxa associations in the healthy and TRD soybean root biomes. (A,B) Correlation networks based on Pearson correlation of ITS (A) and 16S (B) rRNA reads extracted from metagenomes of healthy and TRD symptomatic plants with nodes representing taxa and edges representing correlations between taxa pairs. A connection between nodes stands for a statistically significant (p < 0.05) correlation. Node size is proportional to reads abundance. Blue edges show a negative correlation, whereas red shows positive correlations. Box plots of taxa showing a differential abundance in TRD versus healthy controls to the right.

