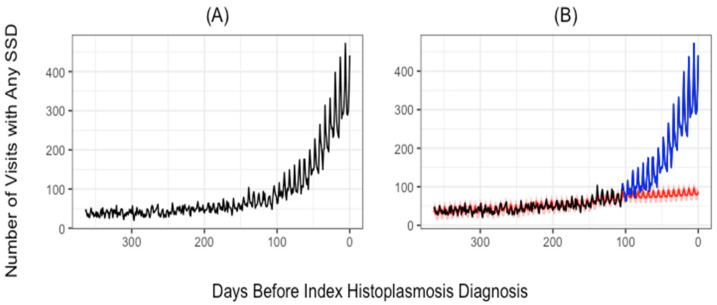
Figure 1.
Trends in observed and expected number of symptomatically similar diagnoses (SSD)-related visits. The number of visits with any SSD-related diagnosis (vertical axis) is plotted for the number of days prior to the index histoplasmosis diagnosis (horizontal axis). Observed SSD-related visits are given in panel (A). In panel (B), the red line was estimated using the data collected before the change point and gives the trend in expected visits. The blue line represents the actual number of visits after the change point. Possible diagnostic opportunities are represented by the area between the blue line and the red line.

