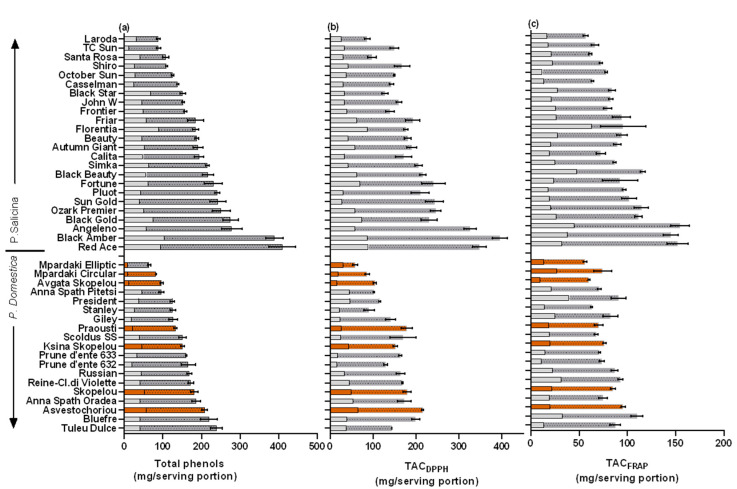
Figure 3.
Mean (±SE) (a) total phenols (TPs, mg gallic acid equivalent) and total antioxidant capacity using the (b) DPPH (TACDPPH) and (c) FRAP radicals (TACFRAP) (mg ascorbic acid equivalent), expressed as per serving portion (100 g FW). The percentage (%) contributions of peel and flesh are shown as empty and hatched superimposed columns, respectively. Colored columns represent local cultivars. LSD; total phenols = 35.9, TACDPPH = 33.2, TACFRAP = 19.1.

