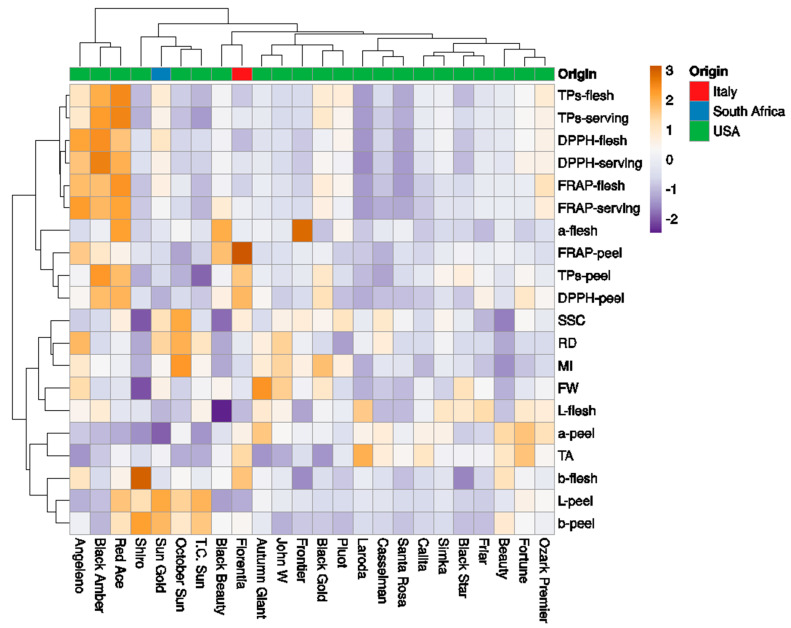
Figure 6.
Heatmap showing the clustering of fruit phenotyping traits in 24 Japanese plum cultivars using the ClustVis software. The columns correspond to the cultivars and the rows correspond to the fruit phenotypic traits studied. Both rows and columns were clustered using Euclidean distance and the Ward method.

