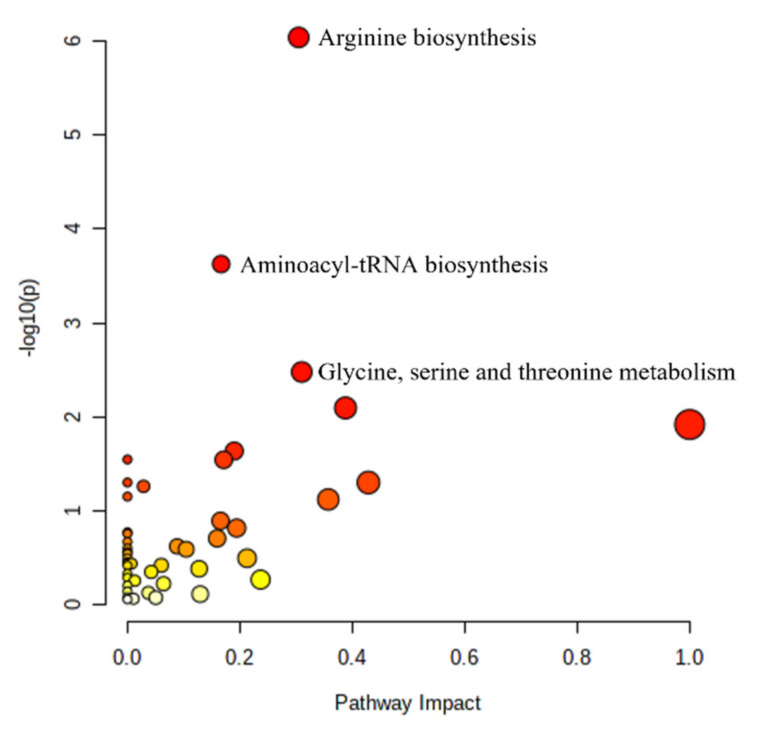
Figure 2.
Pathway Analysis for FEV1-annotated pathways indicate pathways with FDR < 0.1. The colors for each pathway refer to the −log10(p) of the over-representation raw p-value (unadjusted for multiple comparisons) with red to yellow indicating a higher to lower −log10(p) values. The pathway impact represents the importance of the matched metabolites normalized by the importance of all metabolites in the pathway.

