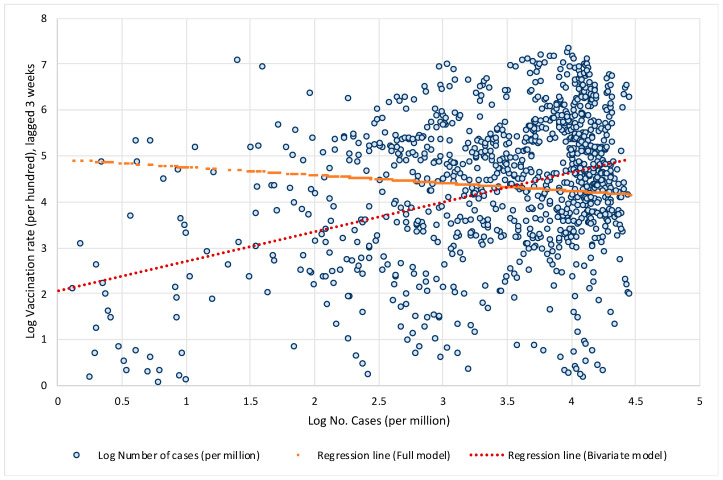
Figure 2.
Log vaccination rate and log number of cases per million. Notes: Based on results presented in Table A1 in the Appendix A. Data by weeks, period 1 August to 14 November 2021, for 110 countries. Data are specified in natural logarithms; data on vaccination are lagged by 3 weeks. For the Full model the constant term was scaled up. Source: Our World in Data; own calculations.

