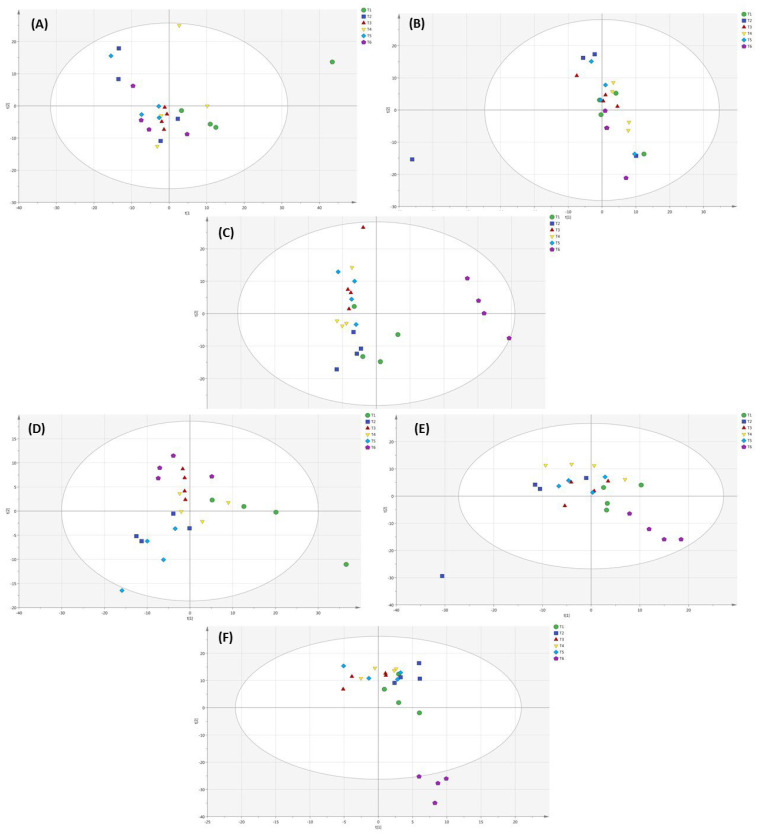
Figure 7.
PCA and PLS-DA analysis of the metabolomic profile of lettuce with different applied NH4+/ NO3− ratios (100:0, 75:25, 50:50, 25:75 and 0:100%) and control (no additional N applied) in soil, substrate and hydroponic cultivation systems by GC-MS analysis. Note- (A–C) represents PCA analysis and (D–F) represents PLS-DA analysis of metabolomic profiling of lettuce in soil, substrate and hydroponic cultivation systems by GC-MS analysis. Green color represents NH4+/NO3− (100/0%), blue color represents NH4+/NO3− (75/25%), red color represents NH4+/NO3− (50/50%), yellow color represents NH4+/NO3− (25/75%), sky-blue color represents NH4+/NO3− (0/100%) and purple color represents control.

