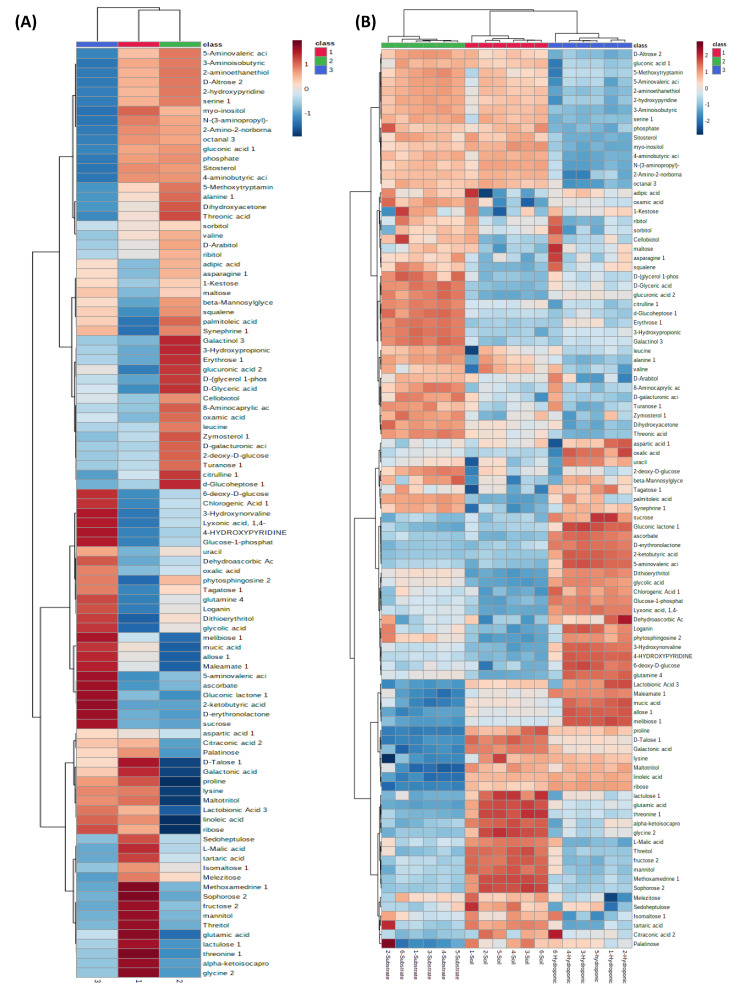
Figure 11.
Heat map of different metabolites in soil-, substrate- and hydroponically grown lettuce. Note- Left-side (A) shows up- and down-regulation of metabolites in metabolomic profiles of lettuce in soil, substrate and hydroponic cultivation systems by combining means of all different applied NH4+/NO3− ratios (100:0, 75:25, 50:50, 25:75 and 0:100%) and control (no additional N applied) in hydroponic, soil, and substrate cultivation systems. Right-side (B) shows variation in up- and down-regulation of metabolites in metabolomic profiles of lettuce by various applied NH4+/NO3− ratios (100:0, 75:25, 50:50, 25:7 and, 0:100%) and control (no additional N applied) in hydroponic, soil, and substrate cultivation systems. Red color represents soil-grown lettuce metabolites, green color represents substrate-grown lettuce metabolites and blue color represents hydroponically grown lettuce metabolites.

